Showing posts with label emerging markets risks. Show all posts

What The Experts Are Saying About Emerging Markets Part 2


Regional Performance:

Asia (Ex-Japan): Asian equities have outperformed mature markets in 2009 thanks to continuous foreign institutional investor inflows amid diminishing risk-aversion among global investors and relatively resilient macroeconomic fundamentals. Markets had gained 46% YTD as of August 31 (78% since October 2008) with India (68%) and Indonesia (75%) the best performers, and China (39%) and Malaysia (36%) the laggards. Sri Lanka posted an exceptional 131% gain due to the end of a 26-year civil war, a US$2.5-billion loan agreement with the IMF and the government's positive stance on reforms and liberalization. Asian markets have recovered 54% of the losses incurred in 2008 (peak to trough, down 59%).

Latin America (LatAm): LatAm equities has outperformed the other emerging markets' regional indexes by rising 59% YTD to August 31 (99% since it hit bottom in November 2008), with strong performances in Brazil (71%) and Colombia (55%). The laggards are Argentina (41%) and Mexico (34%). Overall, LatAm equities market have recovered 46% of the 2008 crash, after falling 68% peak to trough.

Eastern Europe, Middle East and Africa: Equities market went up 42% YTD to the end of August and 77% since reaching bottom in March 2009. Turkey (66%) and Russia (59%) lead the mark, while Morocco (-3%) and South Africa (16%) have underperformed. Eastern Europe, Middle East and Africa stock markets have recovered 39% of the sharp correction induced by the global crisis, after falling 66% peak to trough.

Recent EM market Dynamics:

  • Emerging-market stocks ended higher on November 18, heading for their highest level in 15 months. The gap on yield for developing vs. developed country debt fell due to higher commodity prices and speculation that the U.S. would keep low interest rates until 2012. David Spegel, the head of emerging market strategy at ING Financial Bank NV in New York, says there is “some positive sentiment and upside favoring for high beta countries…Investors are expecting that the Fed will remain on hold for a long time and recognize it as a buying opportunity.” (Bloomberg, 11/18/09)
  • WB President Robert Zoellick says the U.S. has a limited ability to stop the USD decline, while IMF head Dominique Strauss-Kahn says the USD has fallen within a normal range, proving resilient to the crisis. Asian authorities “expressed concern that the global stimulus, especially the flood of liquidity pumped out by central banks, could create asset bubbles and inflation, such as in commodities.” (WSJ, 11/14/09)
  • According to Citi, "Latin American stocks face the risk of a rebound in the U.S. dollar, in the middle of which could be the region’s steepest rally in almost two decades. The biggest fundamental risk of a decent correction in regional equities is, therefore, a bounce in the dollar…As markets enter 2010, the timing of the first Fed move will come closer and the dollar could bounce, triggering a more severe correction in regional equities." LatAm equities are more likely to suffer a correction early in 2010 than at the end of this year. Citi reiterated its preference for Brazilian over Mexican equities. In the face of debt downgrade risk, Mexican stocks are "underweight." (Bloomberg, 10/27/09)
  • Developing-nation stocks headed for a steep three-day slide as concern mounted that central banks may rein in stimulus spending and companies reported lower profits. The MSCI Emerging Markets Index dropped 2%, reaching an accumulated retreat of 4.1% during the week. Stocks in Russia, Turkey, Hungary and Indonesia fell more than 2% while the suffering of large companies in South Korea and Poland was felt in their indexes. During 2009, the MSCI measure for emerging-market equities has rallied 64% as governments pumped about US$12 trillion to spur growth and as signs of recovery drew investors to higher-yielding assets. (Bloomberg, 10/28/09)
  • "Equity fund inflows into the BRICs have reached US$32.3 billion this year (US$10 billion above 2006). Brazil has been the best performer as equity investors have pumped in US$2.44 billion in October (nearly double that of China at US$1.3 billion) due to its position as one of the world largest commodity producers, strong growth in China and the broader optimism about global economic recovery. The strong data in the developing world and a growing view among investors that these markets are likely to offer the biggest returns as their economic growth outpaces the west have attracted US$63.1 billion in inflows this year. This compares with outflows of US$75.6 billion in developed world equity funds." (FT, 10/23/09)
  • After India withdrew its monetary stimulus and increased its inflation forecast, emerging-market stocks fell the most in seven weeks as the MSCI Emerging Markets Index declined 1.3%. The yen rose as investors sought refuge. The Shanghai Composite Index decreased 2.8%, the steepest decline among benchmark equity indexes worldwide, after an early drop in metal prices. (Bloomberg, 10/27/09)
  • Market correction is expected this year as China and other countries cut stimulus funding, since the rally in global markets is basically liquidity-driven, says Peter Westin, the chief strategist at Aton LLC. Earlier in October, Bloomberg reported that investors were throwing money into the riskiest emerging markets at a remarkable pace, buying as if the global financial crisis was over. Emerging-market funds have absorbed more than US$40 billion so far this year, according to fund tracker EPFR Global. "That means that last year's outflow of US$40.1 billion has been completely erased," said Andrew Howell, an emerging-markets strategist at Citi. "We tend to get nervous when inflows surge, suggesting excessive optimism. However, at this point it seems early to get too worried." (Bloomberg, 10/22/09, 10/13/09)
  • "For veteran emerging-market investor Mark Mobius and executive chairman of Templeton Asset Management... China remains the biggest investment destination for emerging-markets funds...Asia and emerging markets overall remain 'solid long-term investment opportunities.' " However, he recommends caution when it comes to short-term investment due to high volatility in today’s markets. (WSJ, 09/30/09)
  • Emerging markets now are "too large to be ignored," despite the misconception that emerging economies have small, illiquid and volatile financial markets. Their market capitalization now represents 30% of the world’s market capitalization (as much as that of the U.S.), 50% of the global economy and the world’s top growth prospects, though they have only a 12% share in the MSCI All Country World Index. (FT, 09/28/09)
  • "Developing-nation equities capped their steepest weekly decline in more than two months on mounting concern that a rally has outpaced economic growth after an unexpected drop in U.S. home sales and factory orders." Markets have not corrected and the economy showed a disappointing reaction to stimulus, says Marc Faber, the publisher of the Gloom, Boom & Doom report. (Bloomberg, 09/25/09)
  • According to a Reuters report, Latin American stocks reached a new 2009 high on September 22, 2009, while Brazil's currency rose to the highest level in a year after the improvement of the country's ratings. Brazil's real strengthened 1% to 1.799 per USD, its strongest since exactly a year ago. The LatAm stock index rose 1.02% to 3,643.10, and the broader emerging markets' stock index added 1.27%. One day earlier, Bloomberg reported that stocks from developing-nations dropped 0.9% after trading at the highest level relative to profits since 2000, according to the MSCI Emerging Markets Index.
  • "Emerging market stocks contracted the most this month after Chinese companies reported worse than expected earnings and Russia's economy contracted by a record amount, creating concerns about an economic recovery. The MSCI contracted 1.4%. On August 3 the MSCI closed above 855.47 on for the first time since the collapse of Lehman Brothers in September, as speculations of an easing to the global recession were bolstered by a positive report on U.S. manufacturing and rising commodity prices. In Asia, stock indices were supported by better than expected earnings from energy producers due to higher oil prices." (Bloomberg, 08/13/09)
  • "Moody's reiteration...of Mexico's existing sovereign credit rating (Baa1), with a stable outlook, does not alter Citigroup's view that the risk of a ratings downgrade is a threat to Mexican equities later this year. Accordingly, the positive market action in response to the Moody’s announcement (including a rally in the peso through P$13.00/dollar) may be overdone." (Citi, 08/12/09)

p/s photos: Sharon Xu


What The Experts Are Saying About Emerging Markets Part 1


As of mid-October, the MSCI Emerging Market Index had gained 68% YTD, while MSCI global equities had increased 24%. Overall, emerging market asset classes have been supported by high global liquidity, improvements in risk appetite, falling core markets volatility (VIX), rebounding commodity prices and relatively stable fundamentals in comparison with past episodes of crisis. Moreover, emerging market countries' policy responses to the crisis has been relatively aggressive, planting the seeds for positive domestic demand. Plus, corporate earnings have been better than expected. Since reaching bottom in November 2008, emerging market equity markets have jumped 105%.

Downside risks remain in place due to uncertainties about the shape of the global recovery (V, U, W, V+U or inverted square root), the strong U.S. dollar (USD), higher U.S. Treasury yields, profit-taking and revival of global risk aversion. Moreover, miscalculations on the implementation of exit strategies around the globe post a significant risk. In September, emerging market equities jumped 12.7%, after declining 0.8% in August (+14.6% in July), lead by Latin America (20%) and Asia ex-Japan (10.8%). Equity markets in Europe, the Middle East and Africa increased 8% as positive news about the global economy continued supporting risk appetite. In the same month, world markets increased 6.6% versus 8.8% in July.

    Outlook:

  • Mark Mobius, chairman of Templeton Asset Management Ltd., reckons that emerging-market economic growth will be about zero this year, compared to a contraction of almost 4% in developed economies. He also said stocks in the BRIC nations--Brazil, Russia, India and China--are likely to rise by 30-40% in the next three to four years. (Bloomberg, 11/18/09)

  • WSJ Columnist Jason Zweig: "Vinicius Silva, an analyst at Morgan Stanley, calculates that emerging markets are trading at 12.9 times their expected earnings over the next year. Since 1993, that average has been 12.8 times earnings. Emerging markets as a whole are neither a bubble nor a bargain." (11/10/09)

  • According to Morgan Stanley (MS), the MSCI Emerging Markets Index might gain 25% by the end of 2010 and finish at 1,200, the highest two-year rally since 1989. Also, they have increased the forecast for 2010 profit growth in emerging markets to 40% (from an initial 28%). (Bloomberg, 11/10/2009)

  • Dr. Nouriel Roubini said on October 4 that the current "party" on emerging markets and markets in general could continue for another six months but will eventually end ugly, as much of the rise in asset prices since March is another bubble created by a huge pool of global liquidity. "I'd argue that rally has been too much, too fast," Roubini said at the Inside Commodities conference at the NYSE. "If we have a V-shaped recovery, then it's justified and assets can rise further. But I believe we'll have U-shaped recovery, in which case those assets could move sideways or they could correct." (WSJ, 11/04/09)
  • Dr. Nouriel Roubini said on October 4 that the current "party" on emerging markets and markets in general could continue for another six months but will eventually end ugly, as much of the rise in asset prices since March is another bubble created by a huge pool of global liquidity. "I'd argue that rally has been too much, too fast," Roubini said at the Inside Commodities conference at the NYSE. "If we have a V-shaped recovery, then it's justified and assets can rise further. But I believe we'll have U-shaped recovery, in which case those assets could move sideways or they could correct." (WSJ, 11/04/09)

  • According to Arnab Das of Roubini Global Economics, emerging markets will extend their biggest rally in a decade as investors borrow dollars to buy stocks, bonds and currencies in the world’s fastest growing economies. Investors should take “overweight” positions in developing-nation assets, said Das, the London-based head of market research and strategy at RGE. The flow of U.S. dollars in emerging markets “is based on better fundamentals for the near term than the G10” through “better growth prospects because of structural reforms and ongoing integration into the world economy,” Das said. (Bloomberg, 11/04/09)

  • According to Allan Conway, head of emerging market equities at Schroder Investment Management, there is room for further gains in emerging-market stocks in the next 1-2 years. Emerging nations will represent 70 to 75% of global growth for the “foreseeable future.” The BRIC countries are at an “early stage” of development that will accelerate, creating demand with rising disposable income for 2.9 billion population. (Bloomberg, 10/13/09)

  • According to Michael Wang, emerging markets strategist at Morgan Stanley: “Previously, emerging markets were seen as a geared play on developed markets because of their dependence on exports. But this is different. Asia and Latin America haven’t had the fundamental problems in the banking sector that the developed world has had, so lending and credit growth has resumed rapidly and this is helping drive growth.” However, Mr Wang pointed out that “There is the possibility of an incipient asset bubble, particularly with regard to China, but that is not our base case scenario, which is still for them to go higher”. (FT, 08/03/09)
  • "Research by Société Générale's cross asset team argues it is time to sell because the price-to-book value of emerging-market stocks is now higher than those in the developed world. The only other time this valuation measure was at a premium to that of the developed world was from mid-2006 to mid-2007. Emerging-market equities fell by two-thirds in the 12 months to the start of November 2008. (WSJ, 07/27/09)
  • According to Citi equity strategists Geoffrey Dennis and Jason Press, “The correction in regional equity markets has reached the expected 10-15% range...Although the mood has turned sour on worries over the timing of economic recovery, there is little more downside from here and we expect regional markets to break out to the upside again later this summer.” (06/24/09)
  • Jonathan Garner, the chief Asian and emerging market stategist for MS, wrote in a research note that "the MSCI Emerging Markets Index may climb to 985 by June 2010 from its closing price of 743.72 on June 18....Profits will rebound 28% next year after a 15% slide in 2009." Earlier, Garner forecast a 20% gain in 2010 and a 25% drop this year. (Shiyin and Paterson)

p/s photo: Yuriko Shiratori

Emerging Markets Traded Past Its All Time High Vs Developed Markets


How many indices do you want to monitor? Well, this is smashing pumpkins on your forehead significant. If you group all the emerging markets and count it as an index, it has just breached through its all time high against the developed markets basket.

We all know that emerging markets were not that badly affected, especially their currencies. The weaker dollar did help the emerging markets over the past few weeks as well. Do the emerging markets have any business pushing through its all time high against developed markets? Well, the key is a posting I made about two weeks back, on a new way to look at risk in emerging markets.

http://malaysiafinance.blogspot.com/2009/09/new-way-to-look-at-risk-in-emerging.html

What that means is that developed markets which used to trade at a premium or rather emerging markets that used to trade at a discount, are now having the roles reversed a bit because trade surpluses, better country balance sheets, savings rate and monetary discipline among emerging markets - all equate to a more attractive picture. While global trade suffered, especially on exports demand by developed countries, many of the emerging markets are finding better trade terms trading with each other. Its not just developed markets that have their stimulus plans, the emerging markets stimulus plans worked better because there was no "massive wealth destruction" in emerging markets as there was in developed markets ~ e.g. foreclosures, negative equity in properties, many ill fated REITs in dire straits...

So, the Dow at 10,000 or not, emerging markets should still chug along. The 10,000 level looked like a psychological barrier but as I have explained many times, its the low rates and lower risk aversion couple with more M&A that are pushing matters along. Stop looking at the nascent recovery in the real economy.

The second table is even more interesting, it looked at markets that have surpassed their all time highs, not their 2008 highs mind you, but all time. Imagine breaching your all time highs months after the most severe recession since the Depression, pretty significant huh.

At the top of the heap, the Colombian market is already 11% higher than its previous all time high. Israel and Chile are just 13% away. Indonesia is only 16% away. Peru just 20% and Malaysia not far behind, just 26% away like Switzerland.

The BRICs had a spectacular run in 2007 and 2008, so its natural for them to be still some distance from their all time highs. Brazil still 30% away despite a very robust market for the past 6 months. India still 37% away. China a massive 44% away. Russia have its own problems and still 57% away.

The US is just 33% away, same as Singapore, but UK is still 43% away. Even the robust Australia is still 35% away, just like HK.

The economies that are really hurting, suffering the most from the financial fallout are those that are the furthest from their all time highs. Roubini, look, many markets have not run ahead of themselves, investors are not stupid, really! Ireland still 78% away from its all time high. Belgium, Finland and Austria still 60% away. Poland and Norway still 52% away. To get some perspective, 50% away for Malaysia means the index is hovering at 700-750 (I think, looking at the new index calculation).

The equity markets rally is not the same for everybody, there is discernment, there is still reward and punishment, there is still discretion and sanity.


New Way To Look At Risk In Emerging Markets


As of the end of August, the MSCI Emerging Market Index have gained 48% year to date, while MSCI global equities have increased 18%. High global liquidity, improvements in risk appetite, falling core markets volatility (VIX), rebounding commodity prices and relatively stable emerging markets fundamentals in comparison to past episodes of crisis are behind the recovery. Moreover, EM countries' policy response to the crisis has been relatively aggressive, planting the seeds for a positive domestic demand story. However downside risks remain in place due to uncertainties about the shape of the global recovery, profit taking, revival of global risk aversion, and higher US Treasury yields. Moreover, corporates may post worse-than-expected earnings reports as Q2's improvements were largely driven by cost-cutting efforts not by a recovery in demand. Since it reached bottom in November 2008, EM equity markets have jumped 81%.

In August, EM equities lost some steam (-0.8% m/m vs. +14.6% m/m in July), lead by a correction in Asia ex-Japan (-5.3% m/m vs. +17% m/m in July), while Latin America (+3% m/m vs. 11.3% m/m in July) and EMEA (+5.1% m/m vs. 11.7% m/m in July) showed less buoyant performances. Increasing concerns about the global recovery, in particular concerns that China's government will start slowing down credit extension and companies reporting worse-than-expected earnings, as well as profit taking and higher risk aversion, capped these markets. In the same month, world markets increased 4.4% m/m vs.8.8% m/m in July.


Outlook:
  • August 3, 2009: According to Michael Wang, emerging markets strategist at Morgan Stanley: “Previously, emerging markets were seen as a geared play on developed markets because of their dependence on exports. But this is different. Asia and Latin America haven’t had the fundamental problems in the banking sector that the developed world has had, so lending and credit growth has resumed rapidly and this is helping drive growth.” However, Mr Wang pointed out that “There is the possibility of an incipient asset bubble, particularly with regard to China, but that is not our base case scenario, which is still for them to go higher”.
  • July 27: "Research by Société Générale's cross asset team argues it is time to sell because the price-to-book value of emerging-market stocks is now higher than those in the developed world. The only other time this valuation measure was at a premium to that of the developed world was from mid-2006 to mid-2007. Emerging-market equities fell by two-thirds in the 12 months to the start of November 2008.
  • July 13: July 13: According to Citigroup equity strategist Geoffrey Dennis and Jason Press “The correction in regional equity markets has reached the expected 10-15 percent range.” “Although the mood has turned sour on worries over the timing of economic recovery, there is little more downside from here and expect regional markets to break out to the upside again later this summer.”
  • The MSCI Emerging Markets Index may climb to 985 by June 2010 from its closing price of 743.72 on June 18th, Jonathan Garner, Morgan Stanley’s chief Asian and emerging-market strategist, wrote in a research note. Profits will rebound 28 percent next year after a 15 percent slide in 2009, Garner wrote. That compares with his earlier forecast for a 20 percent gain in 2010 and a 25 percent drop this year.
  • June 15: Deutsche Bank AG said that Latin American stocks may drop 15 percent this summer (2009) because of increased share sales in Brazil, weaker China bank lending and the unlikelihood of a rebound in the U.S. economy in the second quarter.
  • June 2: The surge in emerging-market equities may last another six months (until the end of 2009) as faster economic growth in developing countries prompts investors to keep shifting out of lower-yielding assets. Emerging-market stocks may keep on gaining as investors shift some of the $3.8 trillion in money market funds into equities.
Regional Performance:

    Asia (ex-Japan): Asian equities have outperformed mature markets in 2009 thanks to continuous foreign institutional investor (FII) inflows amid diminishing risk-aversion among global investors and relatively resilient macroeconomic fundamentals. Markets have gained 46% YTD as of August 31 (78% since October 2008) with India (68%) and Indonesia (75%) as the best performers, and China (39%) and Malaysia (36%) as the laggards. Sri-Lanka posted an exceptional 131% gain due to the end of the 26-year civil war, a $2.5-billion loan agreement with the International Monetary Fund and the government's positive stance on reforms and liberalization. Asian markets have recovered 54% of the losses incurred in 2008 (peak to trough, down 59%).

    Latin America: Latin American equities has outperformed the other emerging markets regional indexes by rising 59% YTD to August 31 (99% since it hit bottom in November 2008), with strong performances in Brazil (71%) and Colombia (55%). The laggards are Argentina (41%) and Mexico (34%). Overall, LatAm equities market have recovered 46% of the 2008 crash (peak to trough, down 68%).

    Eastern Europe, Middle East and Africa (EMEA): EMEA equities market have gone up 42% YTD to the end of August and 77% since it reached bottom in March 2009. Turkey (66%) and Russia (59%) lead the mark, while Morocco (-3%) and South Africa (16%) have underperformed. EMEA stock markets have recovered 39% of the sharp correction induced by the global crisis (peak to trough, down 66%)

    Recent EM market Dynamics:

  • Latin American stocks reached a new 2009 high while Brazil's currency rose to the highest level in a year on Tuesday, after the improvement of the country's ratings. Brazil's real strengthened 1% to 1.799 per dollar, which was its strongest since exactly a year ago. The Latin American stock index rose 1.02% to 3,643.10, and the broader emerging markets stock index added 1.27%.
  • Stocks from developing-nation dropped 0.9% after trading at the highest level relative to profits since 2000, according the MSCI Emerging Markets Index. (Bloomberg, 09/21/09)
  • August 31, 2009: Emerging market stocks fell sharply by the end of August on concern a slowdown in Chinese lending will curb growth in the world’s third-largest economy.
  • August 13, 2009: August 12th: Emerging market stocks contracted the most this month after Chinese companies reported worse than expected earnings and Russia's economy contracted by a record amount, creating concerns about an economic recovery. The MSCI contracted 1.4%. On August 3rd the MSCI closed above 855.47 on for the first time since the collapse of Lehman Brothers in September, as speculations of an easing to the global recession were bolstered by a positive report on U.S. manufacturing and rising commodity prices. In Asia, stock indices were supported by better than expected earnings from energy producers due to higher oil prices.
  • August 12, 2009: Emerging market stocks contracted the most this month after Chinese companies reported worse than expected earnings and Russia's economy contracted by a record amount, creating concerns about an economic recovery. The MSCI contracted 1.4%. (Bloomberg) August 6, 2009: "Moody's reiteration, on Wednesday, of Mexico's existing sovereign credit rating (Baa1), with a stable outlook, does not alter Citigroup's view that the risk of a ratings downgrade is a threat to Mexican equities later this year. Accordingly, the positive market action in response to the Moody’s announcement (including a rally in the peso through P$13.00/dollar) may be overdone."
  • July 28: "I wouldn't want to encourage people to invest in China and India who have never invested before," cautioned Jim O'Neill, Goldman Sachs chief economist. "Wait for a correction."
  • July 28: "Investors around the world have been pouring money into emerging-market stocks faster this year than at any other comparable time on record, despite strategists' fears of a bubble. They plowed a record $35.5 billion into emerging-market stock funds in the first half, according to funds-flow research firm EPFR Global, whose data go back to 1995. By contrast, investors withdrew $61 billion from developed-market stock funds over the same period, EPFR said."
  • July 8:“Risk aversion levels have risen across the board,” said Nigel Rendell, a senior emerging-market strategist at RBC Capital Markets in London. “While sentiment is still uncertain, emerging markets generally will be weaker.”

Asset Class Returns As At 31 July 2009


The month of July was a very exciting month. Things really moved! Emerging markets continued to defy most expert predictions by surging headlong, led by China. It wasn't just emerging markets but developed markets surged as well. The funny thing is that when emerging markets moved, we always get the nasty and critical pieces on how and why emerging markets are too risky and have no reason to outperform the developed markets - hello... how the fuck do you think we got into this current mess, thanks to the fucked up brilliant greedy financial experts in developed markets!!!

REITs is a very interesting vehicle as they will only attract buyers when investors can see a genuine bottoming in the real estate space. Although the REITs are mainly representative of the US sector, it does indicate some vibrancy - despite its 10.4% gain last month, REITs as a whole is still down 41.3% year to date, an indication that there is still a long road to recovery. Another way to look at them is that it is time to really buy aggressively those REITs that currently yields very well (low teens) in Grade A or even Grade B offices. Wait another two months, and it won't be so attractive anymore.

080309.GIF

Despite the concerns over commodity price gains in recent weeks, its pretty clear that the gains have not been excessive. As a group it is only up 3.2% and on a year to date basis, it is still down by 38%.


p/s photos: Chrissie Chau


Central Banks & Their Gold Strategy


We all know that the biggest demand for gold comes from central banks. Just how has their buying or selling strategy been over the last 12 months? Is their strategy influenced by the amount of USD being printed into circulation? Are they afraid of the dollar not being able to uphold its long term value? Will they ever regard holding US Treasuries as an option only? Is any of them seriously hinting of reverting back to the gold standard? By holding more gold and less USD does that mean more flexibility to their monetary policy?

  • Reduced central bank gold selling and increased investor buying may have been helping to underpin high prices in 2008 at a time of turmoil in financial markets. The renewal of the central bank gold selling agreement with a lower threshold suggests that gold sales by central banks will be lower in the next five years, a move the could support gold prices.
  • Gold's share in global foreign exchange reserves is about 10%, the third largest asset by value despite being unevenly distributed across countries. The U.S. and European central banks account for the highest amounts both in absolute terms and as a share of reserve holdings (about 50%). Emerging market central banks have a much smaller share. Gold's share in global reserves declined sharply since the 1950s -1960s.
  • Regulation of Central Bank gold sales

  • In August 2009, the central banks party to the central bank gold agreement (CBGA), who collectively have a gold share of just under 60% in their reserves, agreed to renew the treaty but with a lower maximum sales threshold. Analysts suggest that the marginally lower threshold could provide a "mild support" for gold.
  • The annual sales by the central banks party to the treaty will be less than 400 tons. The previous agreement had a cap of 500 tons per years. The IMF's planned sales of 403 tons are included in the overall cap of 2000 tons from 2009-2014. With the Swiss National bank suggesting it will not sell, only the European central bank and the Banque de France are likely to take advantage to sell. The Italian and German central banks have been reluctant to sell their gold holdings.
  • In H1 2009, estimated net sales by official holders of gold were 39 tonnes, 73% lower than in H1 2008. Net gold official gold sales are expected to be only 140 tons in 2009, the lowest since 1994.
  • In 2008, European central banks sold the lowest levels of gold in about decade, reversing the practice of recent years whereby official sales helped depress gold prices. Banks bound by the central bank gold agreement (most of the European central banks) sold about 343 tons of gold , the lowest since the first agreement was signed in 1999, and well under the 500 ton annual limit.
  • In the fall of 2008, central banks stopped lending out gold to banks as they were afraid they would not get it back. This reluctance contributed to an increase in bullion borrowing costs to 2.649% for one month, the highest since May 2001 and high above recent levels (5yr average 0.12%).
  • An asset allocation assessment would suggest European central banks still have too much gold. EM central banks have low gold holdings in part because of the rising cost of gold and worries about an inability to sell when forex liquidity is required.
  • Gold holdings of Emerging Market Central banks

  • GCC private investors have much higher stocks of gold than its central banks do. However, Qatar increased its gold reserves in 2007.
  • China announced early in 2009, that it had increased its total gold holdings by 75%, likely from shifting non-monetary gold to the central bank. Although that increase now makes China one of the top 5 official gold holders, gold makes up less than 2% of China's $2.1 trillion in foreign exchange reserve by value. On the margins, China is likely to keep adding slowly to its holding but it is unlikely to make purchases on the open market given the potential for disrupting prices and reducing the value of USD holdings
  • Aside from China with 1054 tons, the emerging market central banks with the largest gold holdings are Russia (540 tons), Taiwan (424 tons), India (358 tons) and Venezuela (356 tons) as of May 2009. Aside from Venezuela and Lebanon, the gold shares of which make up 37.5% and 27.5% respectively of total reserves, most of the other large holders have a gold share of only about 4% of reserves.

Gold Sales by the IMF

  • The IMF, the third-largest official holder of gold, intends to sell 403 tons (12%) of its 3217 tons of gold, pending approval from 85% of its members which will likely be given in the fall. Any sales are likely be gradual though and may be sold to central banks.
  • IMF gold sales are unlikely to be disruptive for the gold market and could be positive if the gold is purchased by other official investors (like central banks).
  • The IMF is likely to start selling in 2010, selling about 200 tons a year.


p/s photos: Aya Nakata

Deciphering Hot & Hotter Emerging Markets


Trying to further decipher whether the flow of funds into emerging markets' equity is broad based or selective, is an important question. If it is broad based, then it is primarily a big picture capital flows trend. Generally, when we get the big picture correctly, the smarter money would further drill down to specific markets. Not all markets are created equal. At any point in time, some markets will be more attractive than others based on the prevailing interest rates, growth rates assumptions, equity valuations and other lesser investing factors.

I have managed to come across a great chart by the highly respected Bank Credit Analyst, which basically explains which markets would "see the most action" in this current rally. Anyone could plot a valuation chart based on the country's prevailing interest rates and match that with the country stocks' forward or trailing PER. That would be quite one dimensional. The BCA's chrat is a lot more persuasive in that it is based on forward and de-trended (I don't even want to attempt to know what that word meant, but it sounded so sophisticated) trailing PERs, price to book ratio, and dividend yields shown relative to the average of 18 countries".

Hence it is a peer-to-peer analysis. There is one major shortcoming in that tabulation, in that it does not take into account the historical average valuation of each specific market say over the past 5 years. The BCA chart only looks at how each country is faring in valuation terms relative to one another. For example, if Malaysia's historical PER forward valuation was 18x, and HK's historical PER forward valuation figure is 15x - naturally if we just look at PER, HK will always look cheap relative to Malaysia. However if the current forward PER for Malaysia and HK are 14x and 13x respectively - HK would still be cheaper on a straight out valuation but in actual fact, we should look at its PER now compared to the historical valuation for a more nuanced and value-add commentary, whereby Malaysia's market would be the 'cheaper' one.

Besides that caveat the BCA chart looks very good indeed.

From the BCA chart, the most attractive markets NOW:
1) Czech and Thailand - these are "false favourtites" in a horse race. On valuation matric, they are the most attractive and cheapest, but their valuations have been skewed because of extreme financial distress (in Czech Rep) and heavy political uncertainty in Thailand. Hence we need to take these two out or at least regard them with a lot of conservatism.

2) HK - Its looking really good, tus explaining the surge in hot money there. Shanghai and Shenzhen are not so open to foreign funds, hence much of the hot money has been diverted to HK as proxy.

3) Poland - Cheap on valuations.

4) Malaysia - You wouldn't get many houses recommending Malaysia, but the BCA thesis puts Malaysia as highly attractive. Bank Negara's recent decision to leave rates unchanged makes things hotter still till the next BN meeting.

5) South Africa & Hungary - These are attractive but have very high rates, which indicates that money might be flowing out of these two countries. In an effort to retain capital flows, these rates are kept high. In instances like these, foreign funds regard these as tricky markets as your equity gains could be erased by a weak local currency in the end.

China is very hot even though its not the most attractive on valuations, it is a relatively closed market and the surge in bank lending (i.e. liquidity) over the past 6 months has ensured a most vibrant market.

Singapore unfortunately may be trailing the rest of the emerging markets as valuations wise, it is not that attractive. Still, trailing it may be, it will still enjoy some partying albeit much less enthusiasm.

Emerging Markets Bull Run To Continue?


    The sharp outperformance by emerging markets in general compared to developed markets have rankled some experts in the US. They would cite that the outperformance is unfair, that emerging markets are loaded with huge risks - yea.. thanks for the subprime fucking mess dudes ... low risk indeed.

    According to the MSCI Emerging Market Index, emerging markets stocks have gained 80% to July 27 since it reached bottom in November 2008 . High global liquidity, improvements in risk appetite, falling core markets volatility (VIX), rebounding commodity prices and relatively stable emerging markets fundamentals in comparison to past episodes of crisis are behind the recovery. Moreover, EM countries' policy response to the crisis has been relatively aggressive, planting the seeds for a positive domestic demand story.

    However downside risks remain in place due to a bleak corporate earnings outlook, worries over the real economy, revival of global risk aversion, and higher US Treasury yields. So far this year (to July 27), EM equity markets have jumped 47% YTD, while global equities have increased 12%.

    Outlook:

  • July 27: "Research by Société Générale's cross asset team argues it is time to sell because the price-to-book value of emerging-market stocks is now higher than those in the developed world. The only other time this valuation measure was at a premium to that of the developed world was from mid-2006 to mid-2007. Emerging-market equities fell by two-thirds in the 12 months to the start of November 2008.
  • July 13: July 13: According to Citigroup equity strategist Geoffrey Dennis and Jason Press “The correction in regional equity markets has reached the expected 10-15 percent range.” “Although the mood has turned sour on worries over the timing of economic recovery, there is little more downside from here and expect regional markets to break out to the upside again later this summer.”
  • The MSCI Emerging Markets Index may climb to 985 by June 2010 from its closing price of 743.72 on June 18th, Jonathan Garner, Morgan Stanley’s chief Asian and emerging-market strategist, wrote in a research note. Profits will rebound 28 percent next year after a 15 percent slide in 2009, Garner wrote. That compares with his earlier forecast for a 20 percent gain in 2010 and a 25 percent drop this year.
  • June 15: Deutsche Bank AG said that Latin American stocks may drop 15 percent this summer (2009) because of increased share sales in Brazil, weaker China bank lending and the unlikelihood of a rebound in the U.S. economy in the second quarter.
  • June 2: The surge in emerging-market equities may last another six months (until the end of 2009) as faster economic growth in developing countries prompts investors to keep shifting out of lower-yielding assets. Emerging-market stocks may keep on gaining as investors shift some of the $3.8 trillion in money market funds into equities.
  • May 26: If the US economy surprises on the upside, Chinese economy surprises on the downside, or the financial sector lead global sectors, developed markets will outperform emerging markets equities.
  • May 18: Emerging-market stocks may gain an average of 20 percent this year as they rebound faster and stronger than their peers in developed countries, according to Black Rock Inc. The global economy has probably seen its worst in the past two quarters, with developing nations already starting to emerge from the recession.
  • April 21: The bulls say that this is just the beginning of a sustainable recovery in global risk appetite, supported by signs that Chinese demand is growing again and hopes that the U.S. economy is not free falling anymore. The bears say that, although the medium-term outlook for emerging markets is appealing, the prospect of a slow and painful global economic recovery will translate into bouts of selling pressure.
  • April 21: There are still significant downside risks and it will be important to differentiate between emerging markets. Asia remains best positioned and CEE and CIS are the most vulnerable.
  • April 16: "Emerging-market stocks will surge a further 39 percent this year as government spending and interest-rate cuts from China to the U.S. revive demand for developing nations’ exports", according to JPMorgan Chase & Co.
  • Regional Performance:

    Asia (ex-Japan): Asia (ex-Japan): Asian equities have outperformed mature markets in 2009 thanks to FII inflows, hopes of economic revival in H2 2009, and fiscal stimulus and liquidity measures that are finding their way into equities. These factors might be making some Asian markets expensive. Markets have gained 48% YTD as of July 27 (82% since October 2008) with China (50%), India (65%) and Indonesia (62%) as the best performers, and Vietnam (22%) and Malaysia (35%) as the worst. Sri-Lanka posted an exceptional 141% gain due to the end of the 26-year civil war, a $2.5-billion loan agreement with the International Monetary Fund and the government's positive stance on reforms and liberalization. Asian markets have recovered 56% of the losses incurred in 2008 (peak to trough, down 59%).

    Latin America: Latin American equities has outperformed the other emerging markets regional indexes by rising 55% YTD to July 27 (92% since it hit bottom in November 2008), with strong performances in Brazil (up 68% YTD) and Chile (up 55% YTD). The laggards are Argentina (up 22% YTD) and Mexico (up 27% YTD). Overall, LatAm equities market have recovered 44% of the 2008 crash (peak to trough, down 68%).

    Eastern Europe, Middle East and Africa (EMEA): EMEA equities market have gone up 36% YTD to July 27 and 69% since it reached bottom in March 2009. Russia (51% YTD), Turkey (44% YTD) and Israel (30% YTD) lead the mark, while Morocco (-0.3% YTD) and South Africa (10% YTD) have underperformed. EMEA stock markets have recovered 35% of the sharp correction induced by the global crisis (peak to trough, down 66%)

    Recent EM market Dynamics:

  • July 28: "I wouldn't want to encourage people to invest in China and India who have never invested before," cautioned Jim O'Neill, Goldman Sachs chief economist. "Wait for a correction."
  • July 28: "Investors around the world have been pouring money into emerging-market stocks faster this year than at any other comparable time on record, despite strategists' fears of a bubble. They plowed a record $35.5 billion into emerging-market stock funds in the first half, according to funds-flow research firm EPFR Global, whose data go back to 1995. By contrast, investors withdrew $61 billion from developed-market stock funds over the same period, EPFR said."
  • July 8:“Risk aversion levels have risen across the board,” said Nigel Rendell, a senior emerging-market strategist at RBC Capital Markets in London. “While sentiment is still uncertain, emerging markets generally will be weaker.”
  • June 24: Overall, regional markets are now in full correction mode. This correction is now the longest and sharpest since the impressive regional rally that began on March 2 and took MSCI Latin America 73% higher in almost exactly three months. This correction is unlikely to turn into a rout due to (1) improving global and regional growth prospects; (2) a likely trough in regional earnings over the next few months; and (3) the low cost of capital, including short rates.
  • June 18: Emerging-market stocks fell for a fifth day, the longest losing streak since January, amid concern credit losses at banks will mount. The MSCI Emerging Markets Index dropped 0.8 percent to 743.41 at 2:10 p.m. in New York, taking the benchmark measure’s five-day slump to 6 percent and trimming the gauge’s 2009 gain to 31 percent.
  • June 10: According to JPMorgan Chase & Co., Latin American equities are poised to climb at least 22 percent by the end of 2009 because shares are cheap relative to history, global investors may increase stock holdings from a near 20-year low and commodities may rally. The investment bank said that the MSCI Latin America Local Index will advance to 73,882 in 2009. The index closed at 60,256.08 on June 9th.
  • June 8: Emerging-market stocks dropped the most in two weeks as Credit Suisse Group AG advised selling Taiwan shares and speculation the Federal Reserve may raise interest rates curbed demand for higher-yielding assets. The MSCI Emerging Markets Index fell 1.9 percent to 772.25, the steepest drop since May 21.
  • June 3: Reuters found that Central and Eastern Europe lagged behind the general trend in the current stock market rallies. Despite rebounding by 30-40% over the past three months to June, CEE bourses still generated rather small turnover and rallies were patchy.
  • June 3: Sub-Saharan African markets have been among the worst performing markets in 2009 struck by domestic conditions of high government borrowing and commercial banks’ exposure to margin lending. South Africa the best performing market in the region has risen by a mere quarter. Sub Saharan Africa is experiencing a slump in private and aid inflows since the onset of the global slowdown which is a prime factor behind the underperformance of its equities.
  • June 3: In late October, EM equities hit a bottom and started to rise. Since then, the FTSE emerging markets index has outperformed the developed markets index by 48.8 per cent.

p/s photos: Rachel Kum

Chinese Equity A Bubble In The Making?


Well, that should not even be a question, its a fact. The question should be for how long. Just because a market is considered expensive, does not mean one should get out immediately. It will be a tug of war. A bubble is usually because there is a concentration of liquidity and a flush of liquidity, as explained numerous times in this blog. Yesterday saw China markets doing a whipsaw, falling dramatically but still regaining some ground back. That is a prime example of a very strong momentum market. It will be volatile but the investors and players are not ready to leave the playground yet. Hence on rumours of possible tightening by the central bank, the markets will take that as an excuse to take profit and take some chips off the table. I don't think the China markets and HK market included will be paralysed so soon. Judging from the liquidity exhibited in recent IPOs in HK and Shanghai, this rally has some legs. Still, one has to react swiftly, in and out, its a traders' market not a buy and hold market.


    After falling 70% from its peak in late 2007, the Shanghai Composite Index is up more than 80% off its low in November 2008 and 70% for the year. China's total market cap has risen 122% in 2009 to more than 10 trillion yuan. Valuations have more than doubled from their lows in November, but are still well below their peak in January 2008. In July IPOs resumed after new rule changes were put in place.

  • July 10: The Shanghai Composite Index is up 70% in 2009, after falling 70% from the peak in late 2007. The Shenzhen index is up 87% in 2009. Trading on the first IPOs in nine months was halted after they jumped more than 20% from their opening price. The Chinese equity markets have rebounded on the back of the fiscal stimulus, expectations of a recovery in property markets and signs of improvement in domestic demand have given markets another boost
  • Some of the new loans extended during the Q1 surge in bank lending likely found their way into the equity market as investors seek better return on assets, this could imply that the lending surge is not being invested in sectors that will boost growth- and that stock market gains are vulnerable especially given that Chinese equity returns have become more correlated with global trends
  • China and other emerging markets have outperformed developed markets in 2009, suggesting that investors believe emerging markets have "decoupled" again. Another view is that emerging markets underperformed on the way down, and are over-performing on the way up—suggesting not decoupling but rather that they are performing like high-beta assets

  • Are Higher Valuations Sustainable?
  • Stocks on the Shanghai Index traded at 28.1 times earnings in early June 2009, more than double the 12.9 factor they traded at in Nov, but below their peak in Jan 2008 at 50 times earnings
  • Citi: Ample liquidity continues to push up asset prices. After strong lending growth through April, the market expects a slowdown in May/June. But May’s volume could be close to April’s (RMB591.8b), and June could see further growth, thanks to the non-seasonal pick-up in economic activities for the summer months
  • DBS: State-owned enterprises' profits track exports more closely than GDP growth, suggesting that profits will remain under stress even as domestic conditions improve. Sticky wages and increasing commodity input prices increase the pressure from the cost side. Further, because inflation is likely to pick up before corporate profits, SOE's will likely face tighter credit conditions before their balance sheets improve
  • Policy responses have boosted confidence and prevented further contractions of consumption and investment. Property, retail, and auto sales are healthy in volume terms, even if prices remain deflationary. The real impact of the stimulus will take time to filter through the economy and will show up in H2 2009
  • The Chinese equity market continues to be speculative because hedging tools are limited (deterring institutional investors) information on the companies is sparse. Level of government meddling in the market makes true transparency difficult Many retail investors (who led the boom in 2007) retreated to demand deposits
  • After a surge of IPOs in 07-08, there have been no new issues since Sept 08, when regulators feared new supply could further damage existing shares. The China Securities Regulatory Commission issued new regulations for listings on June 11 and has taken legal actions intended to ensure that Chinese markets are less prone to manipulation; IPOs are expected to resume soon
  • New listings and release of block shares could drain funds from existing shares, threatening this year’s gains. The rule changes are intended to increase access for retail investors to IPOs, and limit the valuation surges that followed flotations in 07-08
  • In an apparent attempt to reduce market volatility as new IPOs come online, the government is requiring that SOEs that have listed since 2005 transfer 10% of their shares to the social security fund, which will be subject to a 3-year lock-up period
  • In 2007, regulations intended to deflate Chinese equity markets were implemented (stamp tax raised from 0.1% to 0.3% in May 07), these were mostly reversed in 2008 when markets fell sharply (stamp tax repealed completely in Sept 08). In an attempt to boost existing shares, IPOs were suspended in Sept 08
  • The average daily volume on the Shanghai exchange has more than doubled to 13.6bn yuan in May 2009 from a low of 4.4bn yuan in Aug 2008

  • Sectoral Outlook
  • Citi: Consumer-facing sectors could benefit from policy shifts that would help boost domestic consumption. Auto sector profits trail sales growth, banking sector profits down y/y but show q/q momentum, cement and food/beverage sectors should outperform, and insurance sector looks positive
  • UOB: A pick-up in demand in H2 2009 should benefit energy producers. Dropping property inventories and the massive reduction in equity ratio requirement (20% from 35%) for new ordinary residential projects will boost the property sector, in turn boosting demand for steel and aluminum, as well as energy
  • Planned massive infrastructure spending on the mobile network over the next 3 years should boost the telecommunications sector. Export-oriented industries (steel, shipbuilding, coal), despite stimulus spending, are reliant on a pickup in global demand
  • Fidelity: railways, materials and the property companies may benefit from stimulus efforts. Industry leaders may benefit from consolidation. The large scale railway expansion should also boost demand for steel and cement. Conversely financial services and energy companies place more challenges ahead
  • Domestic retail sales continue to grow on the back of government subsidy programs and the wealth-effect of rising asset prices, however exports remain in contraction.
  • Chinese oil demand returned to positive growth in April, and Chinese oil firms were able to use favorable credit conditions to purchase assets abroad when oil prices were depressed


p/s photos: Suzanne Sae

Emerging Markets Torrid Outperformance


It appears that the rest of the emerging markets have outperformed S&P500 enormously since the beginning of the year. What does that mean? One, that emerging markets have been unfairly whacked, i.e. oversold relative to the problems of the global economy. Two, the return of funds to emerging markets on valuation attractiveness. Three, some of these emerging markets may be recovering earlier and faster than the US. Four, the exports dependency factor has been magnified at the expense of domestic demand resilience.

Russia's RTS stock index was up another 3.2% today, while China was up 1.71% and India was up 2.3%. The BRIC (Brazil, Russia, India, China) countries continue to surge higher in 2009, as they've far outpaced stock markets of so-called "developed' countries. Below we highlight their year to date performance compared to the S&P 500. As shown, Russia is up a whopping 72.1% this year, followed by India at 51.6%, China at 44.6%, and Brazil at 39.7%. The S&P 500 is up 0.22%.

Bric529


p/s photo: Meisa Kuroki

Asian Equities Vs Developed Markets Outlook


  • 2009 MSCI Asia (ex Japan) performance in USD terms: 11.0% ytd as of Apr 24, 2009. MSCI AXJ Index rose by 34.4% during the March 2-April 24 period
  • Best performers: China: 32.1%| Pakistan: 25.2%| Taiwan: 24.3%| Sri Lanka: 20.6%| Korea: 19.2%| India: 17.9%| Indonesia: 16.3%| Malaysia: 11.8%| Philippines: 11.4%
  • Worst performers: Thailand: 5.6%| Singapore: 3.2% | HK: 3.1%| Vietnam: -0.6%
  • In 2009: Asia's equity market (ex Japan) have outperformed mature markets, up 11.0% ytd as of Apr 24 2009, while the U.S. Dow Jones Industrial Average and S&P 500 Index fell by 10.6% and 7.0% respectively during the same period. With the exception of Viet Nam, all Asian equity markets rose since the beginning of 2009
  • From March 2009: Asian equity markets have witnessed a rally following a surge in U.S. markets and began to benefit from the widening valuation gap on the back of relatively resilient macroeconomic fundamentals
  • Valuations: Asian equities are now reaching the lows seen during the 2001-2002 recession. Taiwan (26.3x) and China (22.1x for A-shares) are valued most exceeding 20 times reported earnings, whereas Indonesia (9.9x), Pakistan (9.4x) and Singapore (9.3x) are cheapest when compared to their regional peers. Given China's aggressive fiscal and monetary policies to stimulate domestic economy, A-shares are valued more than B-shares (15.8x)
  • 2008 Review: The peak-to-trough decline in Asian equities in 2008 (more than 70% for some markets) surpassed the 60% fall in local currency terms during the 1998 Asian financial crisis. Sustained outflows from offshore Asian funds took total net redemptions in Jan-Oct 2008 to a record high such that all money that flowed in during 2007 flowed out
  • 2009 Outlook: Asia markets will need to offer more attractive growth and valuations than the rest of the world in order to attract fund flows into the region. Asia valuations, however cheap by its own historical standards and cheaper than the U..S, are still more expensive than the 8.6x median of 46 countries (DBS). Nonetheless, given decreasing inflationary pressures and relatively healthy fiscal positions, further fiscal and monetary stimulus policies by Asian govts will able to boost the region's equity markets in H2 2009
  • Upsides: AXJ region is now attractively valued, and buying into most of the region's equity markets seems a better bet than bonds amid increasing bond issuance. continuous FII inflows to Asian equity markets since early March have taken ytd net flows to a positive US$1.6bn in mid-April 2009, with 4-week average as strong as those experienced in 2006 and 2007
  • Downsides: gloomy earnings forecasts, worries over the U.S. economy, exit by local investors and also FIIs alarmed at greater than expected impact of global slowdown on Asia's growth, exports, fiscal deficits, slowing consumer spending and investment may have negative impacts. Investors may move money to bond markets from equity markets in an anticipation of slower global economy's recovery due to the spread of swine flu. High (external) debt exposure of corporate sector in some countries and risks of real estate correction and bank profitability are additional risks
  • Market Integration: there is a noticeable upward trend in the Asia-U.S. correlation with the correlation parameter picking up sharply in H2 2008 (peaking during mid-Oct 2008). However, average correlations for emerging Asian equity markets are generally higher between the region's markets than with the US markets
  • Government intervention: Several countries including Taiwan, Pakistan, Vietnam, Thailand intervened in the stock market by narrowing the trading band, introducing stabilization fund to contain volatility, banning short-selling, directing govt funds to buy shares


p/s photos: Han Ga In

Emerging Markets Exposure


When should you have an exposure to emerging markets? Should you always have an exposure in emerging markets? If you are a global funds manager, you can only underweight or overweight or go neutral weighting on emerging markets. They are usually very small markets. No serious fund managers will be able to follow each and every one in detail. When the big picture is right, then its time to go into emerging markets. Can emerging markets rally on its own without foreign funds inflow,... unlikely. Because of the sheer weight of foreign funds flow, when they start to move in, its hefty. Another trait is that rallies will be superb but will not last. You will not get the 3 or 5 year bull runs like in the US. Its a hit and run. If you get a one year bull run, thank your lucky stars. Emerging markets are not for buy and hold players.

Emerging markets are your girlfriends, not wife material.

Looking at the top and bottom performers for each year, you will find themes such as export-driven markets, resources rich markets, BRICs play, Latam play, ... in the same way when the run is over, either resource dependent countries will get hit, or export contraction concerns, or currency misalignment issues, or mismanagement of government or corporate debt levels, or bubbles bursting in property... but the one prevailing "really bad factor" is political stability (or lack of). If there is political unrest or uncertainty, funds will shun your markets for a long time.

Which emerging markets will outperform in 2009. It has to be the ones least affected by the global banking crisis and the ones that can lead the way in sufficient stimulus. China and some of the Latam countries should be the outperformers. Export dependent nations will have to play catch up. Eastern Europe and Central Europe should be the worst performers as their problems will take a lot longer to unravel and fix.

Top 5 / Bottom 5 markets

2005
Egypt +161%
Columbia +107%
Jordan +73%
Russia +73%
Pakistan +63%
----------
Morocco +13%
Thailand +8%
Taiwan +6%
Malaysia +2%
Venezuela -24%

2006
China +82%
India +73%
Morocco +68%
Argentina +67%
Peru +62%
---------
Thailand +11%
Pakisatan +3%
Israel -5%
Turkey -7%
India -30%

2007
Peru +94%
Brazil +79%
Turkey +74%
India +73%
China +66%
-------
Hungary +16%
Columbia +15%
Mexico +12%
Taiwan +8%
Argentina -4%

2008
Morocco -11%
Columbia -25%
Israel -30%
Chile -36%
South Africa -38%
------------
Hungary -61%
Turkey -62%
India -64%
Russia -73%
Pakistan -74%

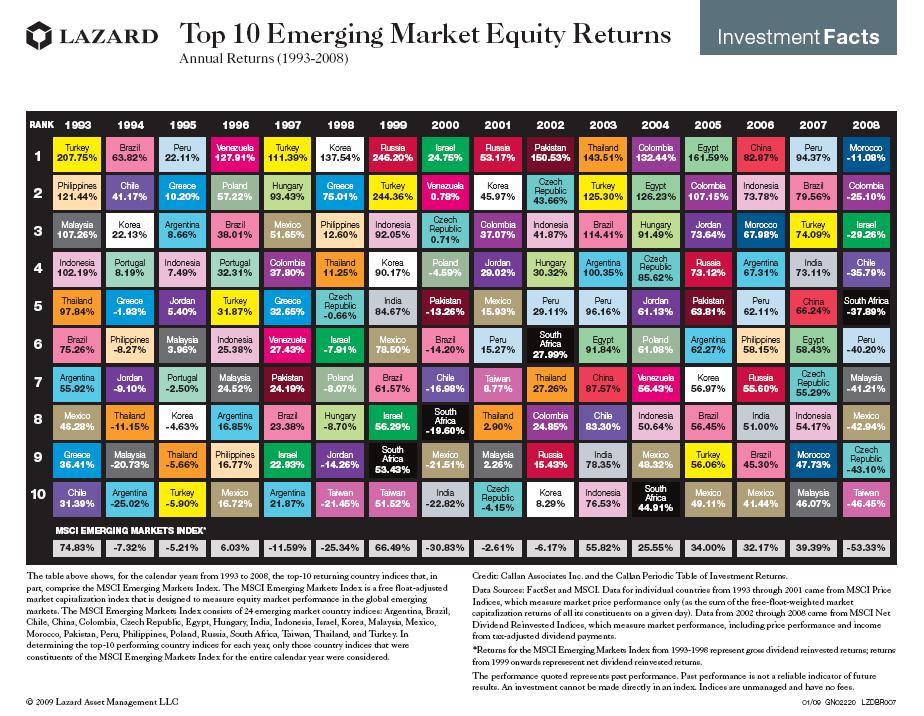
1. Top 10 Emerging Market Returns Chart (1993-2008):

click to enlarge

Morocco, Colombia and Israel were the three top countries in 2008.

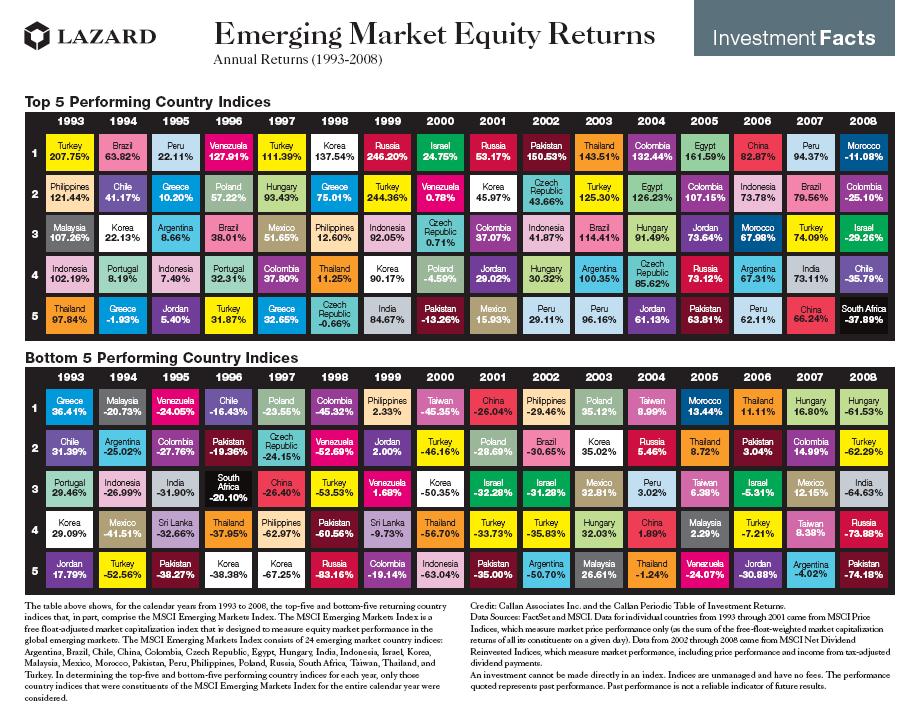
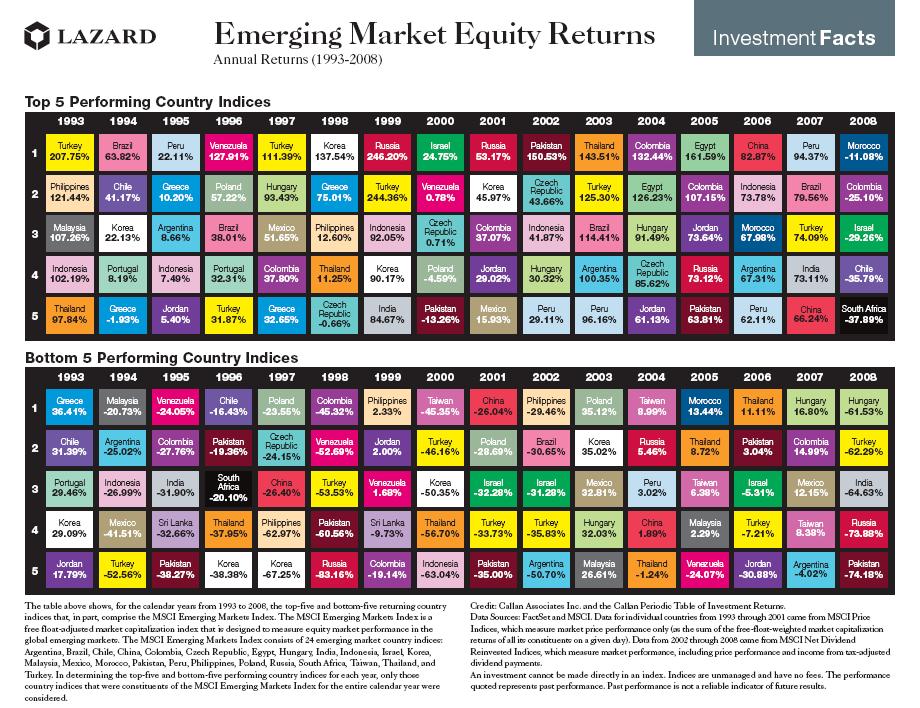
2. The Top 5 Best and Worst Performing Countries Chart:

Last year Pakistan was the worst performer with a loss of 74%.


http://seekingalpha.com/article/126834-top-emerging-market-equity-performances


http://seekingalpha.com/article/126834-top-emerging-market-equity-performances


p/s photos: Tang Wei

Marky Mark On Markets


Well, we have two Marks. Marc Faber, the famous Dr. Gloom and Mark Mobius, the Yul Brynner wanna-be from Templeton Emerging Markets. Surprisingly, both sounded pretty similar this time around. I generally agree with both, but 20% in 2009 is a bit low to me.

Marc Faber: China and other emerging markets offer value over the next two years as growth picks up, investor Marc Faber said. Investors should buy stocks and other assets in China after the market falls to its 2008 low to profit from an expected recovery, Faber said in an interview with Bloomberg Television. China is the world’s best-performing stock market this year.

“Rapidly growing countries have setbacks from time to time,” Faber, the publisher of the Gloom, Boom & Doom report, said in Hong Kong. “I think we’re going to test the lows again, but over the next two years, it’s probably a good time to invest.”

The MSCI World Index has retreated 18% this year, extending last year’s record 42% slump, amid concern the widening financial crisis and global recession will sap corporate profits. The Shanghai Composite Index, which tracks the larger of China’s two mainland exchanges, has gained 16% in 2009.

China is betting that a 4 trillion yuan ($900 billion) stimulus package and interest-rate cuts will help it reach its 8% growth target this year. The global economy is expected to expand at a 0.5% expansion, according to the International Monetary Fund. Industrial and precious metals are attractive investments after the Reuters/Jefferies CRB Index of 19 commodities “collapsed,” Faber added. The CRB Index has dropped 8% this year, adding to the 36% retreat in 2008.

“Asset markets have already discounted a lot of the bad economic news,” he said. “ Some assets like commodities are very, very inexpensive.”

Faber had advised buying gold at the start of its eight-year rally, when it traded for less than US$300 an ounce. The metal topped US$1,000 last year and traded at US$932.78 an ounce today. He also told investors to bail out of US stocks a week before the so-called Black Monday crash in 1987, according to his website. He continues to favour gold, which has gained 19% in the past six months because currencies including the US dollar are “not desirable”. Stock markets are “not particularly expensive” and investors should consider buying them in anticipation of a recovery, Faber advised. The MSCI global index is valued at 11 times reported earnings, half its 10-year average multiple of 22.

“We also have a lot of equities that are not particularly expensive because they’ve collapsed,” Faber said. “These are relatively sound companies and whenever the recovery will come, they will be in a strong position.”

Mark Mobius: Veteran fund manager Mark Mobius sees a potential 20% rise in emerging market stocks in 2009 and views extreme investor pessimism as a signal to gradually start buying equities. "The danger we face now is being too pessimistic," Mobius, the executive chairman of Templeton Asset Management, a division of San Mateo, California-based Franklin Templeton Investments, said in a telephone interview with Reuters.

“We are seeing that slight bottoming out, that we have to be cautious of because if we are caught with too much cash, specifically when we are looking at very good bargains, then we are going to be in trouble with our investors,” he said.

Latin America and Asia are the two favoured regions with China and Brazil among the top country picks. Select countries such as Egypt and Turkey stand out among harder hit regions. “Eastern Europe is pretty much a disaster”. He believes China’s stimulus plan will help it achieve its 8% GDP growth target this year, helping pull up Asia which increasingly sells more of its goods to the world’s third largest economy. Brazil’s diversified economy and growing consumerism also make it attractive, he said.

Mobius manages roughly US$20 billion in emerging market assets out of the firm’s US$377 billion assets under management. Asked how high emerging market stocks might go by year-end: “If you really press me I would say 20% would not be unlikely, and the reason I would say that with some degree of confidence is that we have already come up.”

MSCI’s emerging markets stock index fell 54.48% in 2008. While the index is down 9.46% year-to-date, it has risen more than 15% from its four-year low in October. The Templeton Developing Markets Trust, the main US registered fund Mobius manages, is down 11.44% so far this year after dropping over 57.77% in 2008, according to Reuters data. Cash levels for his portfolio fluctuate between the preferred level of zero and 7% he said. He characterises them as “normal, or certainly not higher than normal”. During the 1997–98 Asian financial crisis, cash levels in his funds reached 20%.

While market volatility may not be over, a market bottom could be in place, Mobius said when asked at what point in the next 12 months investors might claim they’ve cleared a hurdle. “I’m saying that now. I'm feeling that now because of the incredible pessimism that you see everywhere. That usually is a pretty good sign that we are over the hump,” he said.

“Almost universal pessimism is usually a very good time to be buying equities because equities lead the economy,” by six months to a year he said. Famous for his globe-trotting and “on the ground” research, Mobius said of a recent trip to Latin America that while companies were preparing for the worst, customer orders were still coming in and “a lot of them” are maintaining steady investment programmes. On the ground things look OK but with a slower pace. That is on the investment side. The valuations now are very very attractive, even if we do a big markdown on earnings,” he said.

p/s photos: Nia Ramadhani

Emerging Markets Valuations


There are many ways to value a market. The usual suspects are dividend yield, price/ book value, p/ cash flow and PER. On average, for emerging markets as a group, dividend yield is 4.2, P/BV is 1.9, P/CF is 9.5 and FY1 P/E ratio is 9.5. In comparison, U.S. dividend yield is 3.14, P/BV is 1.76, P/CF is 6.93 and FY1 P/E ratio is 11.8. On balance we can see that P/BV for US stocks are still lower than emerging markets average. The other danger is that price / cash flow is more attractive in US stocks. In valuation terms, I would see P/CF as the MOST important out of the 4 indicators because its real cash. Dividend yield while good, can be dramatically lower in future periods if earnings get pummeled. Price / book value is a comfort indicator and would only come into play in a liquidation potential or buyout potential, for on going market valuation, its not that important.

Just from the indicators alone, those critics who say that the emerging markets have fallen as hard as the US markets is wrong. Emerging markets may have some way to go to match US stocks' levels. That is not to say that emerging markets will head towards US valuations. But if the markets are at a premium, it may not recover as fast. For both emerging markets and U.S. markets, this level of fundamental valuation has not been seen in decades. You can also check my last post about stock markets valuation two months ago, just before global sell-off had been triggered. Green indicates attractive valuations, red denotes a sell.

Div.Y. P/BV P/CF P/E

Argentina 1.8 / 1.2 / 4.3 / 5.5
Brazil 2.2 / 1.6 / 4.6 / 6.7
Chile 3.5 / 1.9 / 6.5 / 12.2
China 3.3 / 1.4 / 5.8 / 8.2 ( looking OK on all counts, may be ready to rally)
Colombia 2.3 / 1.1 / 8.6 / 12.8
Czech Rep 6.2 / 2.1 / 6.7 / 8.8
Egypt 5.5 / 1.7 / 5.1 / 6.8
India 1.9 / 2.1 / 8.0 / 10.0 (may still have more room to fall)
Indonesia 5.3 / 1.6 / 5.4 / 7.2 ( its cheap, if the rupiah can get out of its rut, its a very good bet)
Israel 4.0 / 1.6 / 7.2 / 10.1
Jordan 1.7 / 1.8 / 6.1 / 15.2
Malaysia 5.6 / 1.3 / 5.9 / 9.6 (very decent on all counts, any further falls should attract sophisticated buyers)
Mexico 2.1 / 2.0 / 4.9 / 9.5
Morocco 2.8 / 3.8 / 20.8 / 20.5 (should have a lot of room to fall)
Nigeria 4.3 / 3.1 / 4.1 / 9.3
Pakistan 6.4 / 1.7 / 5.5 / 7.3
Peru 6.7 / 2.1 / 7.1 / 7.7
Philippines 4.3 / 1.3 / 5.1 / 9.9
Poland 5.4 / 1.3 / 5.5 / 7.5
Russia 2.7 / 5.8 / 81.7 / 3.5 (this market can totally collapse further)
Slovenia 2.2 / 1.5 / 11.5 / 12.8
South Africa 4.7 / 1.8 / 6.4 / 8.1
Taiwan 7.7 / 1.1 / 3.9 / 9.6 (very cheap, probably the best Asian market to go long)
Thailand 7.7 / 1.0 / 3.8 / 5.5 (even better than Malaysia)
Turkey 5.1 / 1.1 / 3.8 / 5.6 (had fallen enough, now to get the currency healthy again)


p/s photos: Tangmo Pattarathida

The Vital Signs Are Good, Even Though Patient Is In ICU


There are signs that the financial regulators and leaders know what is troubling the global capital markets. If they know, then we are on the way to properly restoring calm and sensibility. More importantly, it will ensure a properly functioning capital markets - which is still not evident now as many stocks have dipped below way past what is considered as fair value. Its pointless to point out which stocks are worth buying as there are too many to mention. You would be better off to try and see the road signs that say that the root problems are being addressed. If they are not doing that, then we will be in the doldrums for a while. However, I can see two major signs which say we should be on the right path. Treasury Secretary Henry Paulson’s comments that signaled he wouldn’t let another large bank fail, large institutional traders began doubling down on bets that large banks would skyrocket. At a time when almost everyone is deleveraging, several funds were in essence doubling their leverage on one trade. This is essential as the statement indicates that Paulson now knows what a catastrophe it was to let Lehman Brother fail (please read recent posting on Lehman Brother, The Rosetta Stone). That will be as close you can get to an admission of grave fault by Paulson.

The major hedge fund Citadel had a conference call over the weekend and agreed with my take on Lehman Brothers:

3:55 p.m.: “One effect we’ve all seen is about the diversity of counterparties. Given the diversity of counterparties around the world, clearly the diversity isn’t enough to deal with some of what we’ve seen in the past few weeks.”

3:54 p.m.: Lehman’s bankruptcy caused “the greatest dislocation we’ve seen in money market history”


The second major issue is the flight to safe currencies such as yen and USD. But, this is not a currency crisis. This is a liquidity crisis, a growth crisis, a confidence crisis. As such, probably the first step should not be to intervene to save currencies. People calling for their central bankers to protect their currencies are calling for the wrong antidote. At a time like this, you don't need or rather you don't want a strong currency. Look at the OZ dollar, there is no way the Reserve Bank of Australia can do much to stem the reversal of the massive yen carry trade effects. The RBA can only do one thing to protect the OZ dollar and that is to raise the interest rates, which is already crippling in light of the over speculated property market there. What good is it to bump up rates and protect your currency and then find your economy in tatters with property markets there compounding. You would have a graver, and longer term disaster in the works. Better to allow the currency to find its own footing. At current levels, the OZ should start attracting some FDI into property for sure and should see a strong boost to tourism. I mean the OZ dollar is even cheaper than the Singapore dollar now by nearly 10%.

The source of aggressive capital flows into the dollar and yen is emerging markets, and it is the emerging market central banks, flush with dollar reserves, who could take action to stem the market frenzy. Naturally this cannot be allowed to continue, especially for Japan, which needs a weaker currency to prevent a more severe deflation in its economy. Emerging markets “need to act the same way the U.S. and European Union has acted. That will address the root of the problem. However, those governments’ assertiveness is limited by their experience.

Ahead of the Asia Europe Meeting, which began Friday, Japan and other East Asian leaders agreed to establish an $80-billion joint fund aimed at fighting the global financial crisis. Much of the movement into yen and USD can be said to be coming from emerging markets themselves, and that needed to be reversed. The setting up of the "fund" is a good start. More collaboration will go some way to slowly unwind the weakness in emerging markets' currencies.

p/s photos: Deepika Padukone