Showing posts with label market analysis. Show all posts

Up Or Down?

After weeks of positive sentiment across all equity markets, Friday saw a pullback. Let's be fair, you cannot be all running at the same time and see no pullback. But its interesting to see what the media and experts say were the reasons for the pullback.


a) China was making news all week, and on Friday the Shanghai Composite rattled world markets with a sudden 5% drop on inflation fears and the threat of tightening by the government. Is this a surprise? Of course not. What is more important is sentiment is still good and the pullback is just a breather. When you run for sometime, you have to pullback even if there were no bad news.

b) US municipal bonds took a huge hit and could be flashing danger signals for further problems to come. Muni prices have plunged as concerns about municipal debt and default continue to grow. So far this has been a back burner issue as everyone has assumed that the Federal government would bail out the states and municipalities, but with QE2 and a new House of Representatives in town, confidence in this outcome seems to be on the wane. So when did the rest of the markets really care about US housekeeping issues?

http://i676.photobucket.com/albums/vv129/sgdaily7/KissyChrissie08.jpg

c) U.S. policy makers had a bad time at the G-20 meeting and while they were getting beaten up there for QE2 and devaluing the dollarIn Seoul, President Obama failed to get a much ballyhooed trade agreement with Korea, and the U.S. delegation took heat from countries like China, Brazil and Germany for devaluing the dollar at their expense. Later in the week, the Chinese again expressed their displeasure with current affairs as Commerce Minister Chen Deming said they didn’t support quantitative easing and espoused on the risks of growing more global bubbles. These are policy concerns, not liquidity driven issues.

d) While investor sentiment remains at extreme bullish levels. However in the U.S., insiders didn’t share the same optimism and set records for selling at a 12-1 ratio, perhaps sensing an interim stock market top. This is a concern.

e) In reality, US data has turned slightly more upbeat, reflected in higher US yields.

http://i676.photobucket.com/albums/vv129/sgdaily7/KissyChrissie12a.jpg

f) As the USD recovered, commodity markets have fallen back to earth with a thud, causing some to say the commodity bubble has burst, that's bull. A weaker USD caused a rally in commodity price, a slight rebound in USD would do the same in reverse, and since when we have a commodity bubble???

g) Debt worries are widespread in the Euro zone, the market is currently fixated on the Irish situation. Rumors are currently circulating that EU talks are underway that will lead to a financial rescue plan for Ireland as early as next week. Ireland’s Finance Ministry stated it had made no application for emergency funding from the EU and the European Commission said it has not received an aid request from Ireland. They are going through the motions. The Ireland issue is much smaller than the Greek's crisis, and the ECB have to do likewise and bail them, so what.


Being bombarded by various news and opinions can make one confused on market direction. Like I said before, all markets are running for quite some time, they have to pause even if there were no bad news. What's irksome is the business channels and media have to write "something" to explain the markets' pullback. As you can see, there are a plethora of reasons if you want a reason to sell.


I do not see any of the given reasons as anything new, we all know that. What is real is we are in for a low interest rate environment. The USD is moving down on QE2 and rebounding every now and then but the downtrend is there, which will move commodity prices higher and support US equity prices as well.

Elsewhere in emerging markets we are on a tear, or rather just starting. Its not a long drawn correction, its a blip. Thing should move up this week.



The Index, Market Tones, Trading Zones

The Malaysian markets last week would be a good subject matter for case study among all business students. Why is that when the index was above 1,350 and headed higher, that the general undertone of the markets was suspiciously muted.


Then the US markets had their biggest fall in months, and the local bourse fell in sympathy in the opening minutes but soon switched screens and started what I would term as the best "trading zone" this year.

Do all syndicates or big players act in concert? I don't know man, but it seems that there is a switch which most of them follow - as to who gets to push the switch, I don't want to guess too much.

The bulk of private investors have been waiting for this kind of "trading zone" - its a period where speculative and stocks with "stories or earnings upgrade" will move, and find good follow through as well. Usually this will last at least 2-4 weeks.


We cannot be looking at the main index to gauge sentiment as the index is too heavily weighted to big caps. The underlying tone of the markets has been set and I have mentioned before that the time is ripe for a run.

If you look at the privatisation of Measat and Tanjong, that could very well trigger a downtrend for the market but it didn't. Then we have the yet unresolved Kenmark situation which was followed by the bitter after-taste Mudajaya debacle - which could have also derailed investors' confidence. But no, the market was marking time.


When something is supposed to go down but does not, it usually will be up. You can infer the same from the above events.

The same is true, if something that is supposed to go up but doesn't, it will go down - these things never stay at parity. Important rule of thumb here. Remember the many times your friends or brokers telling you this stock or that stock will go up because of: new projects / earnings upgrade / owner playing the stock up / etc... if they do not go up, they usually will not stay still ... they will go down.


Enjoy people...

Getting A Hold On Market Weakness

Now that the US markets have been down 3 straight days, I get a lot more queries on "what the hell is happening" ... "is this going to continue" ... Well, first of all, in my lifetime, I have never seen a major correction whilst interest rates are near all time lows, have you??!! We are so used to a robust equity market for the last 12 months, that we lose sight what is a normal dip.

The trouble is exacerbated when fundamentals cannot explain these 3 days of weakness, we go searching for reasons, and usually they are the wrong ones. Some will cite that Obama's health care plan faces a setback with a Republican taking over the late Ted Kennedy's seat... some will say its Obama's thinking of implementing a tax on "traders or firms taking prop positions" ...

The whole thing is further exacerbated by people looking to charts and technicals to explain the situation - this is the best part, when all other reasoning fails, let's look at charts ... well you might as well consult a fengshui master. Charts are not so bad really, they are tools which can help us.

I came across a pretty straight forward guy looking at technicals of emerging markets, pretty OK.
-------------------
Richard Shaw is the managing principal of QVM Group LLC, a fee-based investment advisor based in Connecticut. QVM manages portfolios uniquely designed for each client on a flat fee basis through the client’s own accounts at Schwab, Fidelity or Vanguard.

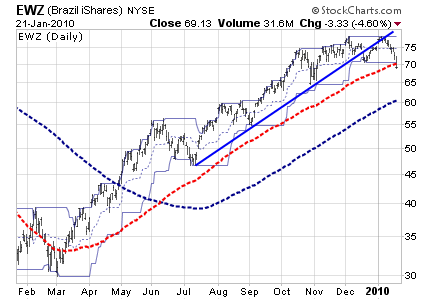
The BRIC countries are a mixed story. Brazil and China have clearly broken support, while Russia and India are still in rising patterns. Brazil may be a Sell. We think China is a Sell. Brazil has broken three conceptual support levels — its trend line connecting recent bottoms, its 21-day lower price channel and its 100-day moving average (in red). The 200-day average (in blue) is about 15% away.

ewz1

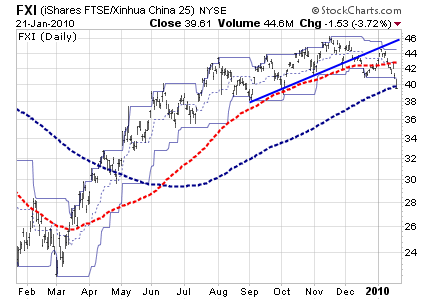
As of January 21, China has broken four of four conceptual support levels, including its 200-day moving average, which is generally held to be a major significance.

fxi

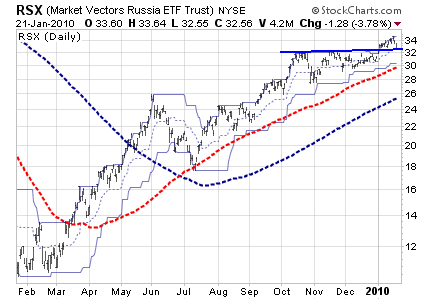
Russia is in a rising pattern, but is testing a support level created by two recent highs that had formerly provided resistance. That support level is above the price channel and moving average support levels.

rsx1

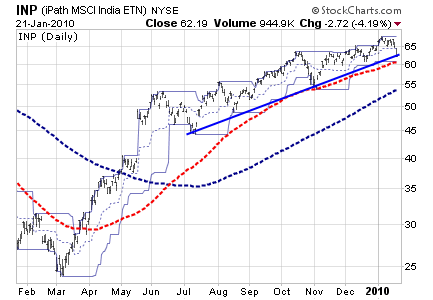
India is still in a rising pattern, but is close to a level where three conceptual supports converge (trend line, lower 21-day price channel and 100-day moving average).

inp

The other countries within the emerging markets index are also a mixed bag.

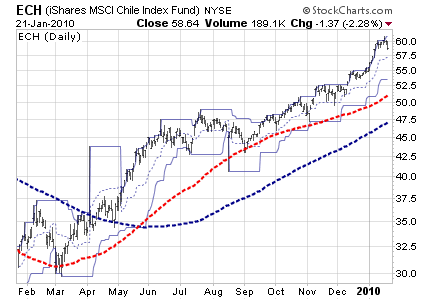
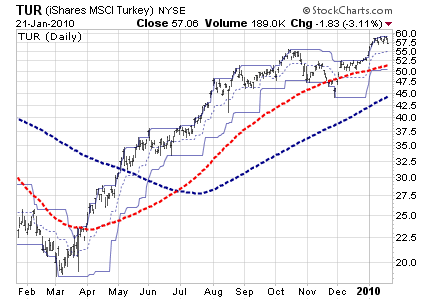
Chile and Turkey are the two with the strongest current price patterns.

ech

tur

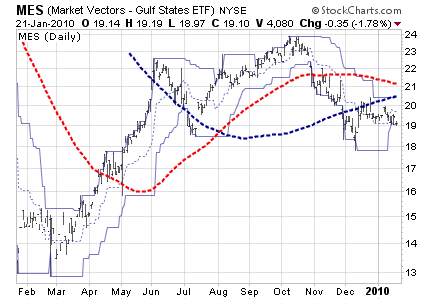
The Middle East has the weakest price pattern.

mes

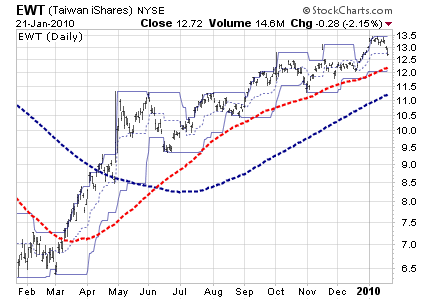
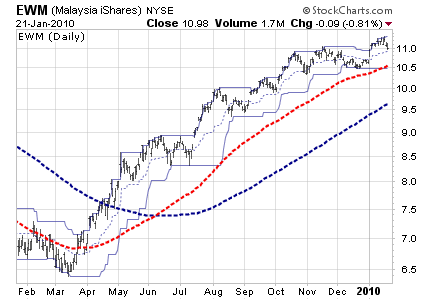
Taiwan and Malaysia are in OK price chart conditions.

ewt

ewm1

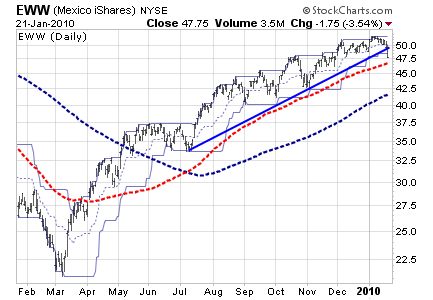
Mexico is still in a rising pattern, but has pierced its bottom connecting trend line and its 21-day lower price channel. The 100-day moving average is not far away.

eww2

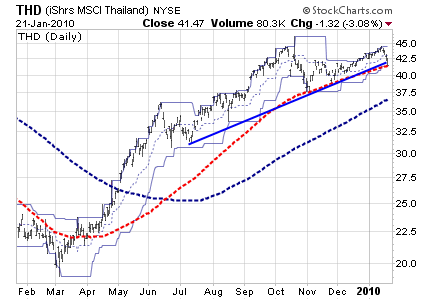
Thailand did not exceed its high achieved in October and is now at critical support formed by the convergence of its trend line connecting bottoms, its 21-day price channel and its 100-day moving average.

thd1

--------------
My concluding view is that we are just in an adjustment mode, I do think the markets will resume its bullishness very soon. I also see some markets drifting away from each other as the domestic liquidity conditions and monetary policies are diverting. Many are trying to rein in excessive lending and excessive property price speculation. I do think Malaysia is less affected by these issues. You should also read the recent posting on PEG ratios to get a better view that not all markets are similar, we are all going up using different routes.

Important View On Dubai World Factor In Equity Strategy


Well, just as swiftly foreign money came into emerging markets, just as swiftly will they leave, and not even on something direct. An indirect scare out of Dubai seems to be enough reason to take the chips from the table. On Wednesday, Dubai World, the government investment company behind some of the emirate's most ambitious projects, said it was seeking to delay repayment on a tranche of its debt. The company has $60bn of liabilities from its various companies including Nakheel, the property firm behind the Palm Jumeirah, the world's biggest artificial island, and the Nakheel Tower, the world's tallest building at 1km high. It also owns DP World, the ports operator that bought P&O Ferries. Nakheel is due to make a $3.52bn Islamic bond repayment, plus charges, on December 14.

Traders feared that the request for a six-month standstill was a sign that the Dubai Government was struggling with its other debts – and that the full impact of the financial crisis globally may not yet be over. British bank stocks, that are among the most exposed in the world to the Middle East, were hard-hit. Royal Bank of Scotland slumped 7.75pc, Lloyds Banking Group lost 5.75pc and HSBC fell 4.4pc – all three are among nine banks who were book runners on an outstanding $5.5bn syndicated loan to Dubai World in June 2008. HSBC's interim accounts showed that the bank had a $15.9bn exposure to the whole of the United Arab Emirates.

The concerns for UK banks also hit sterling, which fell to its weakest point in a month against the euro and a basket of currencies, while gilt futures leapt to a six-week high, propelled by renewed fears about credit quality. Property shares fell sharply amid concerns of a fire sale of Dubai's UK assets, which include the Grand Buildings in London. Dubai has also been a major buyer of UK property.

The risk of corporate default in Dubai clearly shows that contagion risks have not disappeared and that perhaps the market has turned a little complacent about risk. Foreign money flew out of emerging markets yesterday and the cost of borrowing shot up as investors sweated over the prospect of a state-owned Dubai company defaulting and sending another round of shock waves through the global banking system.

Banks in Europe and North America are heavily exposed to the Middle East, and Dubai in particular, with its $80 billion of debt. The cost of borrowing money increased sharply with the increased risk in financial markets. Credit default swap rates (CDS) rising on debt issued out of the Middle East and emerging markets rose, and borrowing costs on Dubai's five-year loan jumped to 5.4 per cent, up 2.24 per cent in two days.

If you look at the emerging nations' stock market performances it gives you a feel of how quickly Western capital will flow out of these nations on default fears. That said, we have to acknowledge that this is largely not long term funds anyway. These funds will find some obscure reasons to get out, if it wasn't this Dubai World situation, it will be some other obscure factor. Thats part and parcel of the high risk of having carry trades into your system. You can complain when they exit, but somehow the same people never seem to complain when they arrive??!! (ala Mahathir).

If nothing is resolved for Dubai World in the next few days you could expect more of the same next week. Uncertainty will breed fear, in other words. However methinks the risk of contagion is relatively low this time around - plus it came at a time when most equity markets were quite robust, and were actually looking for a reason to correct. This would be a good reason to correct - but I would have to say that its a buy on weakness this time around, rather than a "go for a few months holiday" kind of correction. I think markets should have a few more days of weakness, and a good strategy would be to slowly build up positions.

One big thing which most of the Western media have neglected is the role of Abu Dhabi/UAE in this - many seemed to just gloss over this. Abu Dhabi won't allow Dubai's state-owned companies default on debt payments as the global banking crisis limits their access to funds. Dubai and Abu Dhabi are interdependent and one can't be isolated from the other. Abu Dhabi Investment Authority is the world's largest sovereign wealth fund with assets of between $250 billion and $850 billion, according to the International Monetary Fund. The emirate owns more than 90 percent of the U.A.E.'s oil reserves, nearly 8 percent of the world's proven total.

Take all that into account, the risk of contagion and another credit crunch was low. Because seriously, the Middle East is not the engine of growth or a crucial part of the recovery we are seeing in the global economy. The sums that the affected banks will have to bear are not overly large, they can be written down safely, yes these banks' share prices will take a hit, but its nowhere as bad as the subprime situation.


p/s photo: Haruna Yabuki

The Million Dollar Question .....


It had to happen, and it did when Mr. Ooi asked the question that everyone in the financial markets industry dreaded.


Ooi Beng Hooi has left a new comment on your post "Buy Side Vs Sell Side Analysts":

I fail to understand why the calls made by various analysts are so different.

For example, after released of Public Bank quarterly result, some of the calls made by various analysts:

CIMB: Outperform, target price RM 11.10
AMResearch: Buy, target price RM 10.00
Inter-Pacific: Outperform, target price RM 9.75
Kenanga Research: Buy, target price RM 9.30
OSK: Buy, target price RM 8.60
Mayban Investment Bank: Sell, target price RM 7.60
Credit Suisse: Underperform, target price RM 7.50
UOB KayHian: Hold, target price RM 6.88
Citigroup: Sell, target price RM 5.77

Some have "BUY" calls, some have opposite calls and one have neutral position.

Even though Public Bank is considered a transparent listed company with high disclosure of corporate information compared to others, I am a bit surprised to see such wide range of target price, with the highest one almost double the lowest target price.

How can they be so different?

-------------

Financial markets are like economics, its a lot of bullshitting and a small amount of substance. You put 10 economists in a room to come out with a paper on why and how the current global crisis came about, you will probably get a few people killed and still no conclusion at the end of a week.

Put the same issue to a group of scientists, and they will explore the various theories and categorise them accordingly. They will then set up the various testing hypotheses, hopefully they can result in some for of data, hopefully then they can regress the data into some for of equation, hopefully once they have the equation then they can draw a fucking line on a chart, and make the conclusions from the fucking chart. Gawd save them if they cannot get solid data, gawd help them if the data is all over the place, gawd save them if they can cluster the data into a regressed equation, no equation = no formula = no result, no no equation cannot draw line on chart = fucking hopeless study = watse of time.

The difference is if you give financial markets issues to a group of scientists, they will throw their papers and binders in the air after a few months and conclude that the "truth" is nowhere to be found, that you cannot conclusively determine anything from an empirical type of study or testing. Still, the economists, analysts and experts will continue shouting their views and opinions to each other - because in bull shitting you do not need substance, evidence or credibility.

Put 10 analysts in a room to analyse Public Bank, thats what you get. Its a hopeless profession that happens to pay well. Never has so much pay been given to so many for so little contribution!!! Parents now don't want their children to be doctors or lawyers... go be an analyst or fund manager and make 5x times more than the smartest kid who went to study medicine.

Analysts' views will almost always be different because their assumptions are not the same. Some may assume a NPL of 6% over the next 12 months, some just 4% while others may see it at 11%, and that will work its way into your earnings model and risk assumptions. There are many other important assumptions that one has to make in order to do projections: it could be growth, margins compression, staffing cost, local interest rates in 6 months time, in 18 months time, ..etc.

Then you have to make the more important arguments, which are more 'philosophical' and big picture: has Public Bank gone past the "easy growth" era; can Public Bank translate the "winning strategy" in other countries; what will happen after Teh Hiong Piau; are foreign funds holding too much of Public Bank (which means they can only be selling in the future, not buying more); etc...

I have mentioned this time and time again, look for consistency of results in the analysts and house strategy. Follow those who have argued well in the past, look for those who are focused on the more important factors correctly. And... always try to get hold of the extremes, in this case get a hold of: CIMB's which has a new outrageous TP of RM14.10, OSK's which has a TP of RM11.00 and the Citigroup sell which has the TP at RM5.77, and the UOB Kay Hian TP of RM6.88.

They all are different because they have chosen on different ways of interpreting what is good value, what is fair value, and which prevailing FACTORS will be dominating the share price going forward. OSK has held on to the notion that PB's strong loans and deposit growth and superior asset quality will be the focal points for the stock, thus allowing PB's to retain its premium rating and performance.

CIMB's outrageous TP basically affirms that no matter what the management is solid enough to counter and withstand any succession issues. CIMB thinks that earnings growth momentum will remain strong, supported by PB' superior ROE in the 20s, greater contribution from China and new avenue in bancassurance.

Maybank Investment has since upgraded the TP from RM7.60 to RM9.00, but still lagging the rest. They are negative because they see valuations having run ahead of fundamentals. They think that long term ROEs will be in the 15%-18% range rather than the 20s as was predicted by CIMB. The team also felt that beyond the present market rally, the economic recovery remains hazy.

If you ask me, I think CIMB is too fuzzy and trigger happy, all caught up with the partying mode. PB's current valuations have run way ahead. I am not seeing much upside at all, in fact I see it settling between RM8.50-RM10.50 for the next 12 months. The valuations and impressions I get is that it has "no room" for disappointment. It trades at a ridiculously high 80% premium in proice-to-book valuations against its peers - whether justified or not, it clearly show very little upside, unless you think it will trade at 120% premiums??!! My final say on PB, is that its not a stock you want to be holding in a market rally!!! Its a stock you want to be holding in a flat or negative market, its a fucking defensive stock.

So, Mr. Ooi, hope that clears it up a bit, not a defence by any means but hey... we have to remember that accounting is a modern day creation, so too is a stock market, we did not have both 150 years ago (I think). When its a man made thing (and not a natural science like physiscs or biology), it is very very hard to nail down what is the truth at any point in time. It becomes who can bullshit better.


p/s photos: Kristy Yeung Kung Yu

Market Commentary


Just looking at the markets today, some may not know what to make of it. Its like uncertain and the energy is misplaced and incoherent. Looking at the leaders board, Konsort has raced up the volume list, the stock that links it up is Pelikan. They have a mutual substantial shareholder, look it up. There are talks that Pelikan is being planned for a MBO or a private equity buyout (part of the reason why I highlighted it as a buy below RM1.00). Both should be OK for a swift trade. Not encouraged, only for smart and savvy traders who can move in and out quick by looking at volume and trends.

The other thing one can surmise from the gainers is that the realignment caused by the "new" FTSE-KLCI 30 index, which I have highlighted as "very important". The adjustment process favours certain stocks which takes out some of their free float capacity. Hence look for firm support for Tanjong and Commerce.

Some strategic accumulation can be seen in IOI Corp, which looks to me to be a good base building level, or some "substantial shareholder" thinking that this is the "right levels" to accumulate strongly.
Fergetabout UEM Land or Tebrau, never liked their run up as the story is still wishy washy. No follow through, corporate plans all habuk, tarak api punya. I don't like many stocks now as I think markets do look tired, but if you point a gun to my head to force me to buy one stock to hold till rest of they year, I would probably say E&O.


p/s photos: Elanne Kong & Janice Man


Can Asian Markets Continue To Outperform The Rest - Revisited


Asian equity markets have outperformed mature markets in 2009 thanks to continuous foreign institutional investor (FII) inflows amid diminishing risk-aversion among global investors and some signs of green shoots in Asia. As of July 8 2009, MSCI Asia Pacific gained 11.6% ytd with China and Sri Lanka as the best performers, and Australia and New Zealand as the worst performers. Despite impressive improvements, downside risks remain due to bleak corporate earnings outlook, worries over the real economy and revival of any global risk aversion.

Trends
# 2009 MSCI Asia Pacific performance in USD terms: 11.6% ytd as of July 8, up 38.7% during March 2-July 8
# 2009 MSCI Asia performance in USD terms: 11.3% ytd as of July 8, up 38.0% during March 2-July 8
# 2009 MSCI Asia (ex Japan) performance in USD terms: 29.8% ytd as of July 8, up 57.1% during March 2-July 8
# Best performers (ytd as of July 8, 2009): China: 71.5% | Sri Lanka: 56.2% | Indonesia: 53.8% | Taiwan: 47.0% | India: 42.6% | Viet Nam: 41.4%
# Worst performers (ytd as of July 8, 2009): the Philippines: 30.1% | Singapore: 31.0% | Thailand: 29.3% | South Korea: 27.3% | Pakistan: 26.7% | Hong Kong: 23.7% | Malaysia: 21.6% | Japan: 4.9% | Australia: 1.1% | New Zealand: 1.0%
# In 2009: Asia's equity market (ex Japan) have outperformed mature markets, up 29.8% ytd as of July 8 2009, while the S&P 500 Index and the U.S. Dow Jones Industrial Average fell 5.6% and 9.5% respectively during the same period. Continuous FII inflows to Asian equity markets have taken net flows to a positive US$14.4 billion as of June 24 2009, significantly up from US$10.8 billion in H1 and US$9.6 billion in H2 2008.
# Since March 2009, Asian equity markets have witnessed a rally following a surge in U.S. markets and began to benefit from the widening valuation gap on the back of relatively resilient macroeconomic fundamentals. During the March 2- July 8 period, MSCI Asia (ex Japan) rose by 57.1%, significantly higher than the S&P 500 Index and the Dow Jones Industrial Average which gained 25.5% and 20.9% respectively.
# Valuations: Taiwanese shares are the most expensive in the region, 64.6 times reported earnings, followed by New Zealand (38.0x), China (33.1x for A-shares) and South Korea (32.1x). On the other hand, Singapore (12.1x) and Pakistan (9.7x) are cheapest when compared to their regional peers.
# 2008 Review: The peak-to-trough decline in Asian equities in 2008 (more than 70% for some markets) surpassed the 60% fall in local currency terms during the 1998 Asian financial crisis. Sustained outflows from offshore Asian funds took total net redemptions in Jan-Oct 2008 to a record high such that all money that flowed in during 2007 flowed out.
# Market Integration: There is a noticeable upward trend in the Asia-U.S. correlation with the correlation parameter picking up sharply in H2 2008 (peaking during mid-Oct 2008). However, average correlations for emerging Asian equity markets are generally higher between the region's markets than with U.S. markets.
# Government intervention: Several countries including Taiwan, Pakistan, Vietnam, Thailand intervened in the stock market by narrowing the trading band, introducing stabilization fund to contain volatility, banning short-selling, directing government funds to buy share.

Outlook
# Upsides: AXJ region is now attractively valued, and buying into most of the region's equity markets seems a better bet than bonds amid increasing bond issuance. Also, as of end April 2009, market capitalization of Asian Pacific markets ($10.2tn) has come ahead of that of European markets ($9.3tn, including Africa and the Middle East) as Asian stock prices sour at a faster pace than European ones.
# Downsides: Goomy earnings forecasts, worries over the U.S. economy, exit by local investors and also FIIs alarmed at greater than expected impact of global slowdown on Asia's growth, exports, fiscal deficits, slowing consumer spending and investment may have negative impacts. Investors may move money to bond markets from equity markets in an anticipation of slower global economy's recovery due to the spread of swine flu. High (external) debt exposure of corporate sector in some countries and risks of real estate correction and bank profitability are additional risks.
# Given decreasing inflationary pressures and relatively healthy fiscal positions, further fiscal and monetary stimulus policies by Asian governments will able to boost the region's equity markets in H2 2009.
# Prospects for further inflows into Asian equities remain substantial, as global portfolio continue to adjust from relatively underweight positions, and given cheap equity valuations relative to bonds.
# Asian stocks have yet to reflect expectations for a powerful, synchronized recovery in the global economy as markets are still bearish on global growth and on emerging markets growth.
# Markets would likely grind higher first, before dropping by 20-30%: Catalysts for a correction are (1) flattening improvements in second derivatives; (2) softer than expected data coming out of China and; (3) a US% rally, which takes liquidity out of Asia ex.
# The recent rally in Asian equity markets might not continue due to still-weak real economic condition in many countries and the region's ultimate reliance on exports to the U.S. and EU, which means that financial-investor sentiment will remain susceptible to economic setbacks in those markets.


p/s photos: Meisa Kuroki

B.S. & Genuine B.S.


This is another thing which pisses me off royally - i.e. how the media would twist the same fact/issue to suit the trend of the moment. Just read the recent headline from Bloomberg, following the recent sell down in shares globally.


"Oil, Gasoline Tumble as World Bank Predicts a Deeper Recession"


Weaker oil prices now seems to be a convenient excuse of a sell down. The same argument can be used to explain a market rally, in that weaker commodity prices would ensure a good non-inflationary environment suitable for growth.


The dampened economic outlook from the World Bank, a global lender based in Washington, also weighed on the prices of oil, metals, and other commodities. Those price drops in turn sent energy and metal producers' shares falling. The downbeat economic prediction provided a convenient excuse to sell or take profit on a market that had been on quite a tear for the last few weeks.
Hence, for those in the media who taught that the World Bank's assessment was a CRITICAL point of view that led to the sell down... think again... the World Bank report is more like a convenient excuse to sell - there is a world of difference, and the mainstream media always seem to fail to pick these things up. Markets do not jump from one scenario to another within weeks, especially when economic data has been giving the same picture day in day out (green shoots and bottoming data).


Let's look at another example of the diatribe:


"Investors have gone from enjoying a string of better-than-expected economic data to trying to manage a list of worries about the economy. Stocks have lost ground several times in the last month on fears that rising interest rates and inflation would upend an economic recovery. Many analysts also say the relief that erupted in early March about the economy then led to outsize expectations for how quickly a recovery could occur. Other economic news has hit stocks since May. A disappointing government report last month on retail sales suggested the economy remained fragile, and the Federal Reserve reined in its expectations for how the economy will fare this year."


Events searching for reasons??? At any point in time, you can make a good argument for a bear or a bull market in place. We need to decipher between bullshit and genuine bullshit... one of them really tastes like shit.


p/s photos: Joe Chen Qiao En


Where Are We In This Stock Market Rebound? - Deflation Or Reflation Trades


The key historical lesson from past U.S. recessions and severe bear markets is that the stock market tends to bottom out three to six months before the economic contraction reaches its maximum. From the recent economic figures, it is plausible that the U.S. stock market is possibly at a stage where the recession is passing its worst phase. If history is any guide, the stock market should have entered a bottoming process a few weeks back.

Cyclically-sensitive sectors and markets have outperformed as shown in my recent posts, which further signals that reflation trades could soon make a comeback. For instance, emerging markets have continued to outperform the global average. Early cyclicals, such as consumer discretionary and technology sectors, are also beginning to outperform the broad benchmark
equity index.

Finally, it seems that some segments of global financial markets are repositioning themselves for reflation trades. Commodity currencies have experienced a sharp rebound in tandem with the broad commodity price index as well as the crude oil market. In recent history, these moves have been a harbinger of a more broad-based return of the reflation trades.

The key point here is that the decline in stock prices has been the worst since the Great Depression, and has gone a long way to discounting a severe economic recession and financial fallout. Of course, at previous major bear market lows, valuations have been much better than today’s level so it is open to debate whether the worst is discounted – but we should not ignore that reflation this time around is much bigger than ever before, so P/E multiples may not need to go significantly lower than where they stand today. Monetary authorities and governments around the world are getting increasingly aggressive in combating the financial and economic hurricane, all of which means that deflation trades are very late.

The risk-reward tradeoff suggests that going forward, deflation trades are unlikely to reward investors and they should raise their exposure to stocks at the expense of bonds. All that points to a more stable market DESPITE the recent run up. It looks more solid than what I thought it was a few weeks back. A few weeks back, I tended to think it was a bull run with a chance for a 10% correction. But I have shied away from that conclusion, I do think there will be bouts of soft selling which will then attract fresh funds to reposition before launching up the next level. I see the Dow testing 9,300 sometime this year and holding. For KLCI I think 1,140 is possible.


p/s photos: Zhang Xin Yu

Where Are We In This Financial Crisis & Recovery?


Where are we in the global crisis? Are we recovering yet? Why are stock prices rushing upwards when the real economy still looked unsettled? I have tried to convey some answers in my posts before. Let's look at some more related factors:

a) economic statistics - no doubt the stats that have been coming out are still bad, but we have to remember that economic stats are dated, things that are dated means we all should know already, they do not tell us something we don't already know, we went through it, we read about how many companies have been downsizing, we read about plunging commodity price and the Baltic Dry Index, we hear about the number of foreclosed homes ... hence the main aim when looking at economic stats now is to look for signs of recovery, then we have to distinguish between year on year, quarter on quarter and month on month data, year on year is the hardest to calibrate - we already know that things will be very bad on a yoy basis, thus we look at comparative yoy figure for the past few months, yoy figures are important in that it takes out seasonal effects - its the same month as last year, month on month is deceptive because of seasonal effects e.g. figures for February (Chinese New Year effect / holidays / front loading) when compared to March will have the seasonal effect, which is why it is safer to look at quarter on quarter as it would indicate a more genuine trend change ... considering where we are in the recession cycle, everyone should be looking at the rate of decline, or rather the changes to the rate of decline to get at hints of recovery

b) bad news discounted - just how much of the bad news has been discounted, we can only guess, but when you take into consideration the spike in risk aversion over the last 7 months (which can be measured), it is reasonable to assume that prices have more than discounted the bad news because a depletion of confidence and a spike in risk aversion will lead to oversold markets, and thats where we are coming back from, an oversold position

c) bear market rally - in the beginning I would call it a bear market rally, but since February I think its a cyclical market rally, many who call this a bear market rally are those who totally missed out profiting from the rally, the more it rallies, the louder will those who did not buy will shout that it is a bear market rally ... you will also notice that those fundamentals driven experts have gone a lot quieter in recent weeks as the markets continued to climb because they have been wrong and wrong week in week out, hence the only people still shouting are technical analysts, or rather those chartists who also failed to spot the rising trend are now calling for a massive correction ... nobody wants to be wrong and at the same time not being able to make some money when others have traded profitably, beware of the underlying reasons why some people are saying certain things

d) what could go wrong - markets will seize up again if there are major unknowns appearing again, such as if a few big banks were to collapse, or that some of them would require another bailout in the hundreds of billions again, that is not likely after the "stress test" that did not please many people, to me its a very good move by Geithner because it opens up the books and sores for all to see, only with another round of panic will the bond markets seize up, and when they do, the risk aversion will return, looking at what has transpired, that risk has be lowered significantly

So, yes, foreclosures will be bad, unemployment may still rise ( I expect them to peak by end of June/July 2009), pockets of Europe will still be very bad, but the focus has shifted to investors looking for signs of recovery, and every time economic stats DOES NOT say that, markets will just drift lower, but not correct massively, as the amount of liquidity and the need to have an exposure in order not to miss out, will counterbalance the markets in the weeks and months ahead.


p/s photo: Jessie Chiang

No Correction Till 10,000 For The Dow??!!


This was easily one of the better written articles on the markets that I have read for the past couple of weeks. Its by Andrew Butter, and he basically argued that there would be no correction until the Dow reaches 10,000. Its pretty much in line with my views that I have.

Andrew Butter: At Davos, Professor Nouriel Roubini declared that US banks were insolvent. On 14th March he declared that the incipient US stock market rally was a "dead-cat-bounce-..." that would be overturned by the terrible economic prospects.

Last time I looked, the Dow was up almost 30% on 9th March, which puts it well out of normal dead-cat-bounce territory.

And "Hallelujah", the Stress Tests have confirmed "beyond any reasonable doubt" that Secretary Paulson was absolutely correct when he announced to an adoring public in July 2008 that "the US banking system is safe and sound".

Well actually, as Lord Cooper's aide used to say in Evelyn Waugh's classic "Scoop", "Up to a point!"

The "doomsayers", (and there are many) point to (a) P/E ratios (going down to 4,000) (b) the lousy economic prospects, (c) insider selling, (d) the still stinking banking system, (e) creative accounting, and... (Phew!)...(f) corruption and crass incompetence in high places, (and they say this HAS to have an unhappy ending).

I don't have an argument with most of that, except perhaps the "answer"; I'm not so sure that there will be an unhappy ending...haven't we had enough of those for one crash?

Perhaps there is a limit to how much damage you can do to an economy, even if you try real hard - look at Somalia, a failed state. But the Wall Street Bankers can only sit in silent admiration and marvel at how creative young entrepreneurs have figured out bold new ways to rip people off (of course that's just a cottage industry compared to Wall Street - what they need is some organization and a few lobbyists and then do an IPO).

Anyway, as it floated higher the rally got incrementally downgraded to a "sucker" then a "bear" then what...a "chump"?

Now there is apparently a legion of investors scratching their heads and holding their breath, waiting in strained anticipation for the next thing they don't understand to bite them in the backside.

But Professor Roubini is always right...RIGHT!

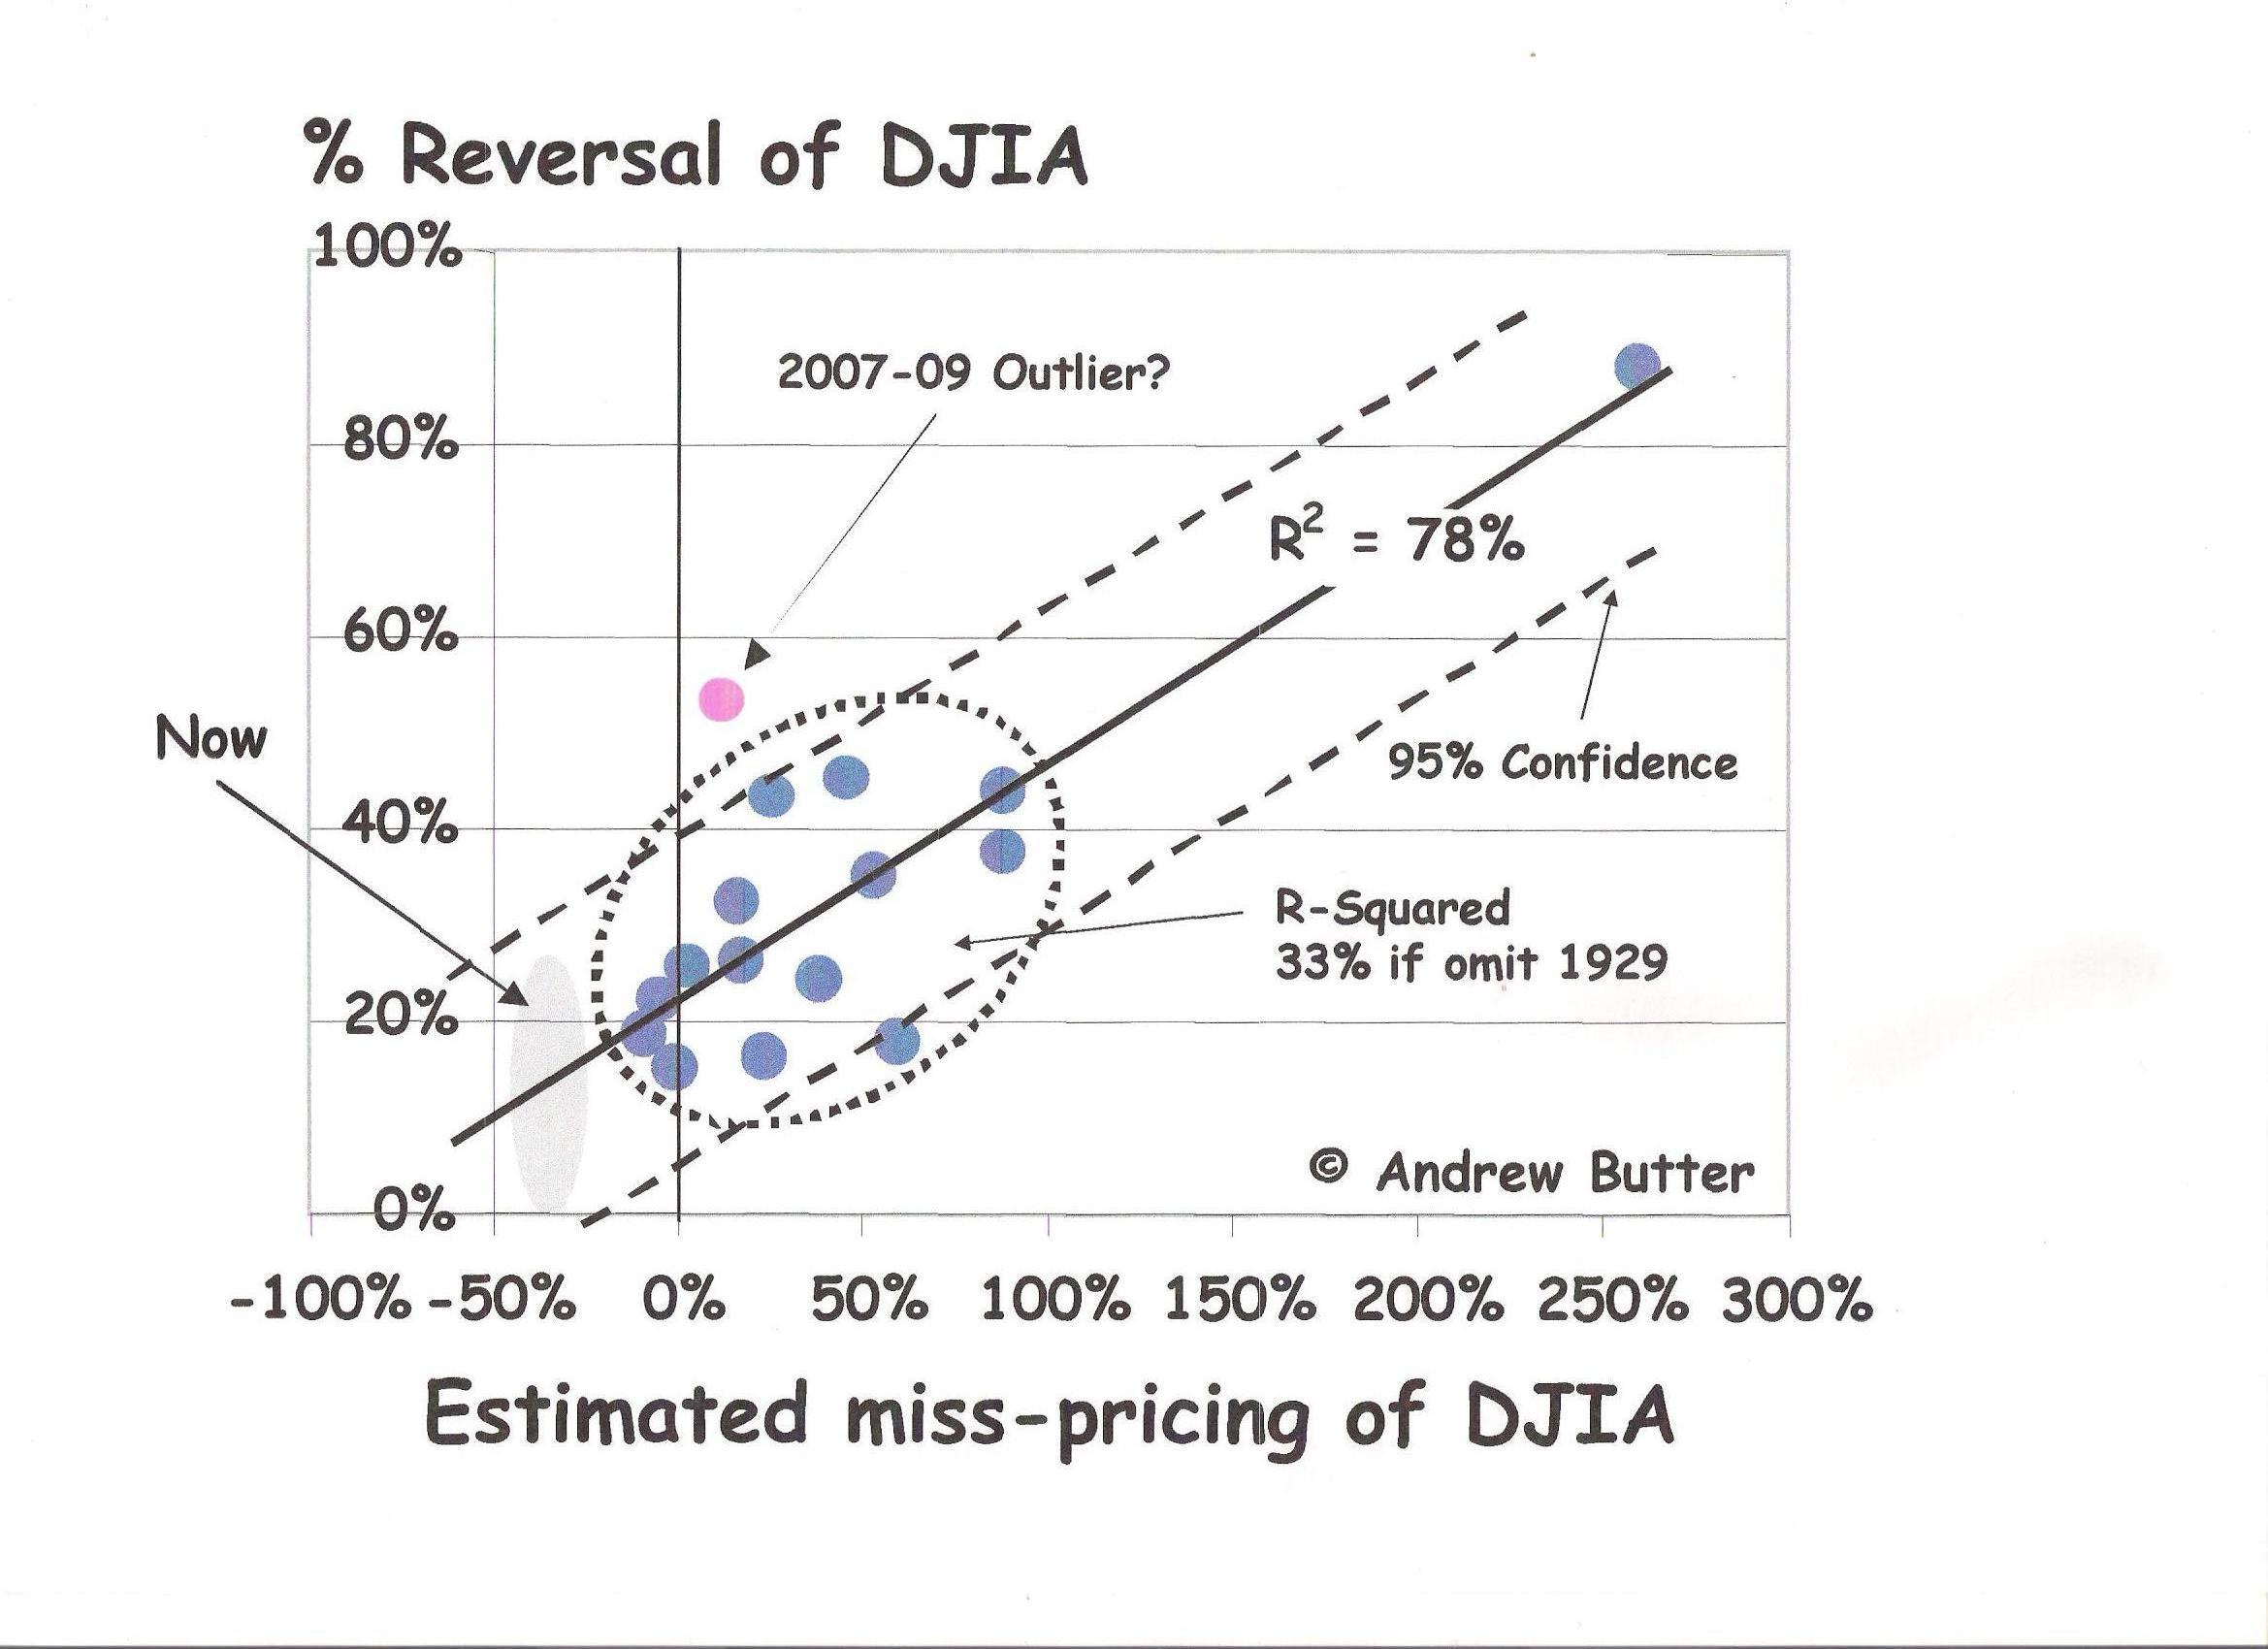
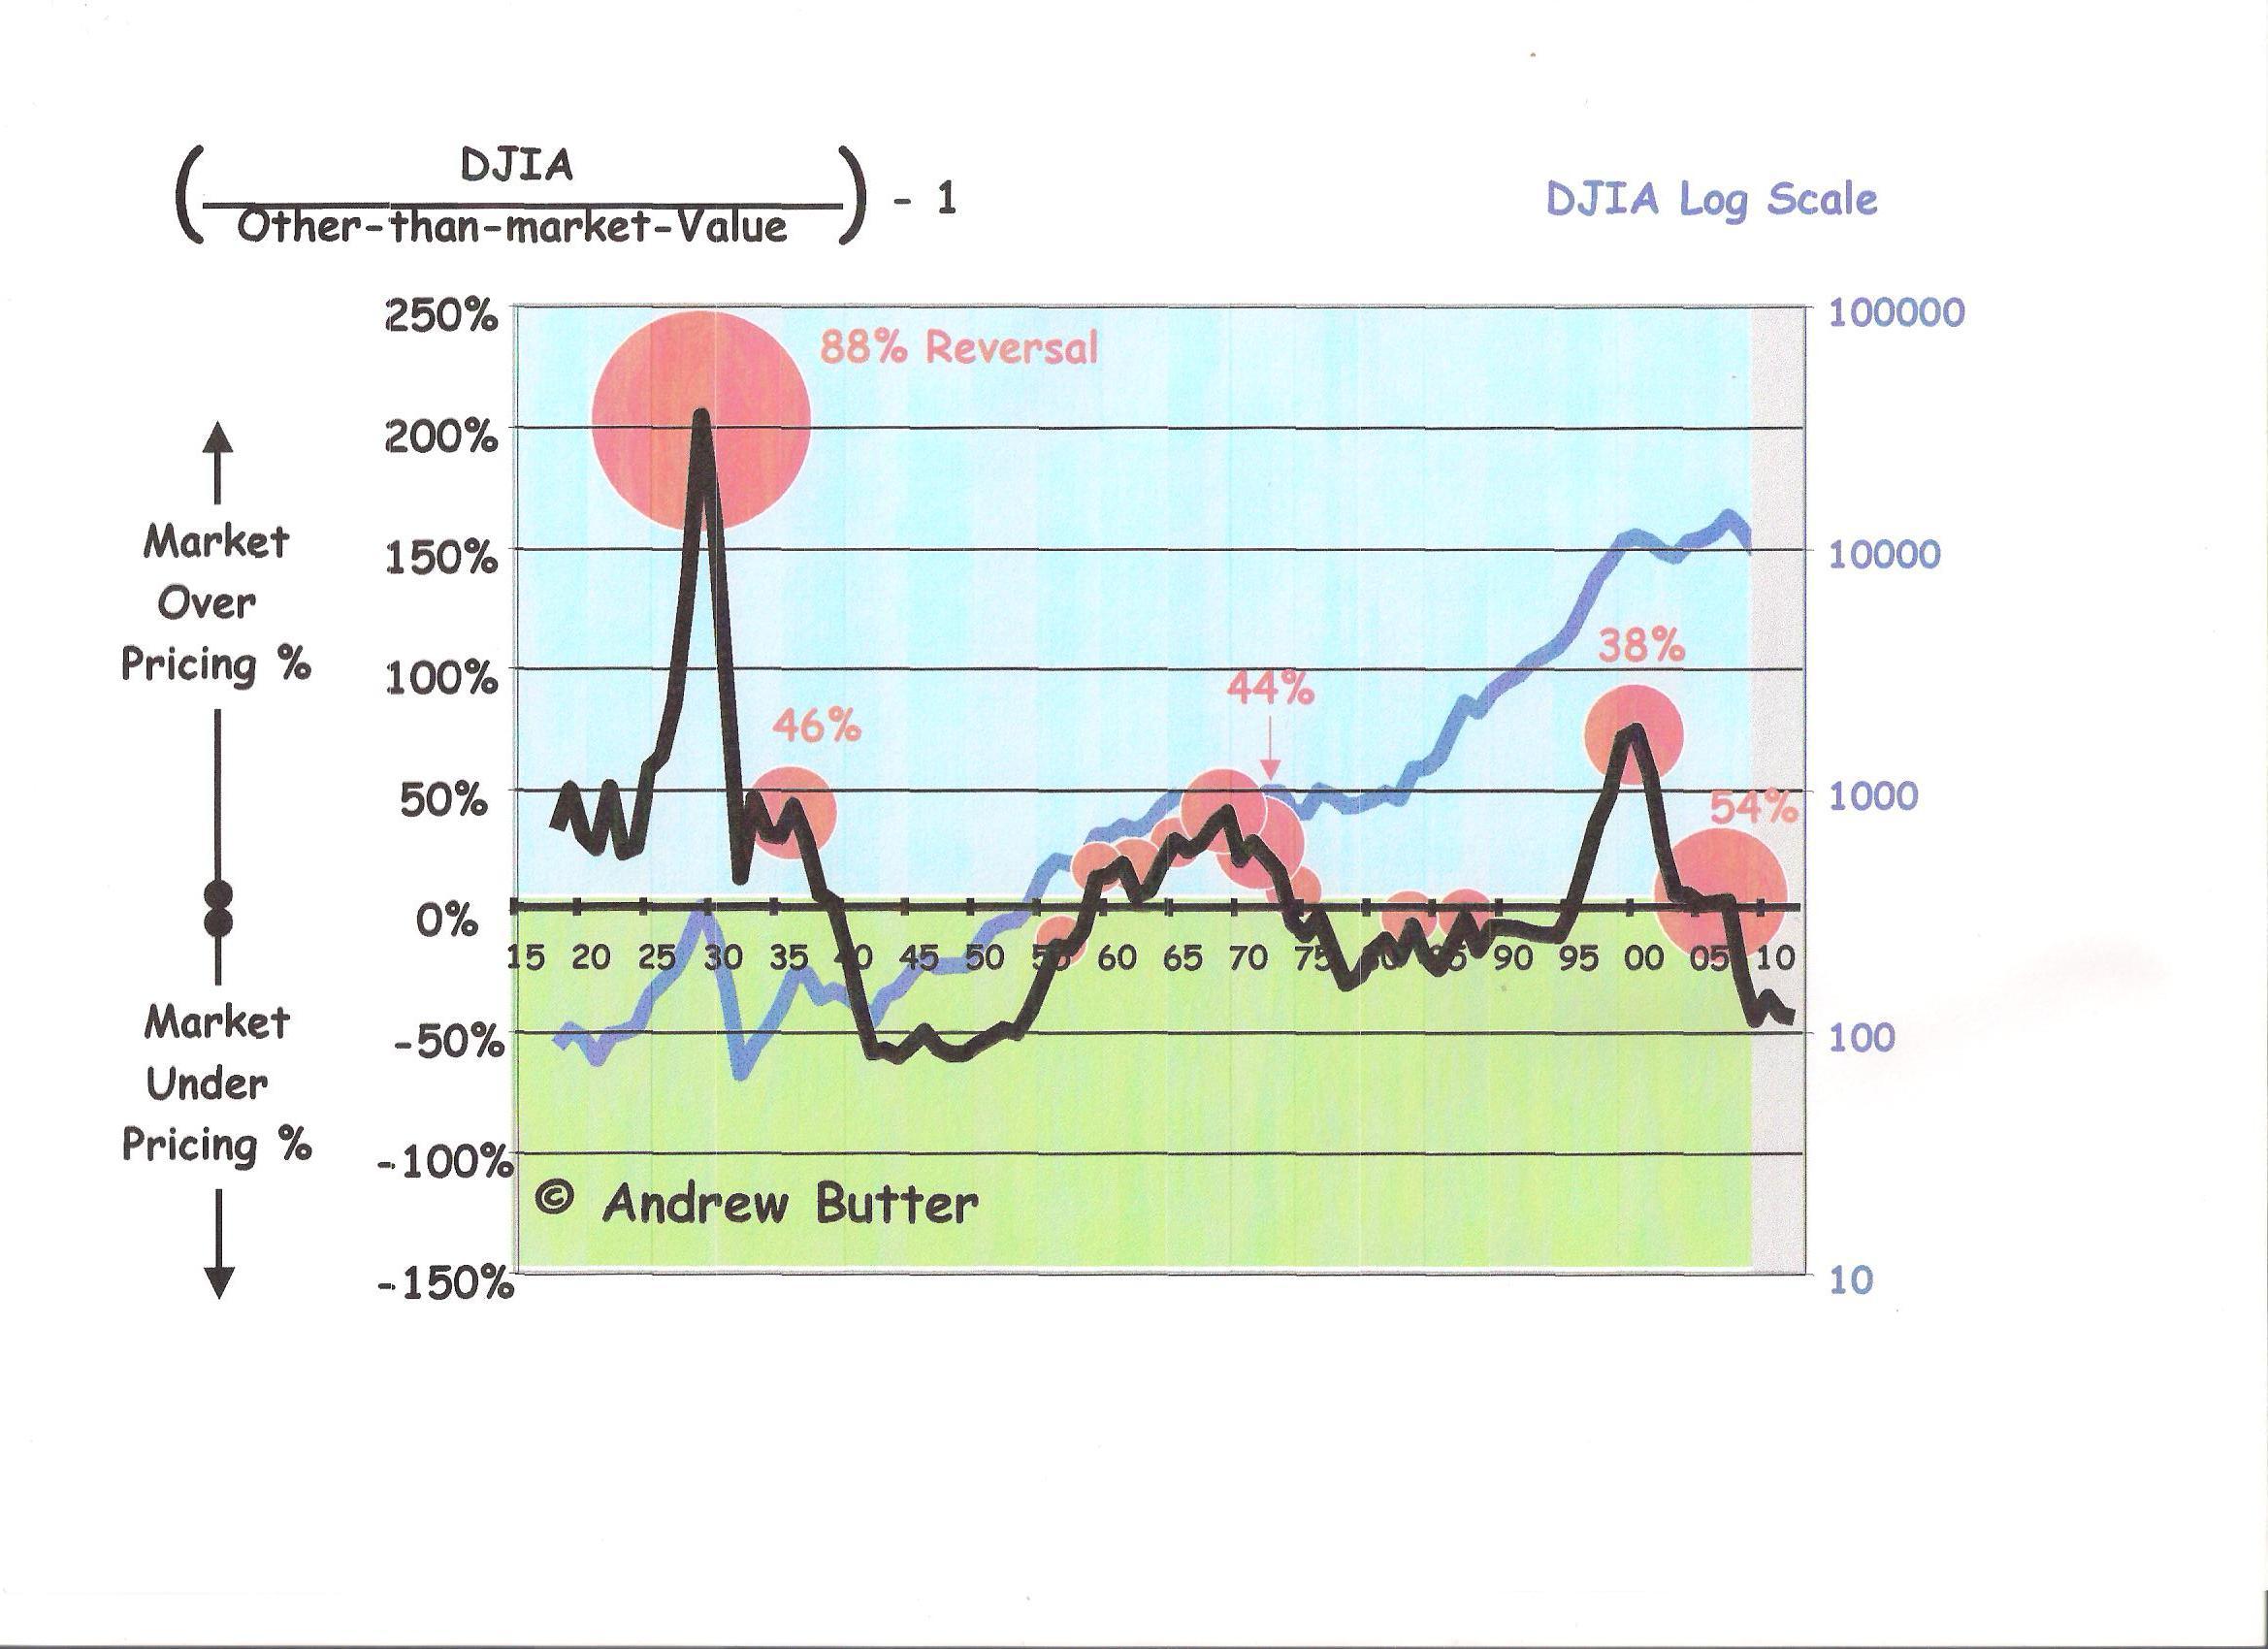
Well, up to a point. This chart compares the size of reversals over 15% for the DJIA since 1929 with the extent of mis-pricing (mis-pricing is explained here).

click to enlarge

So for that limited amount of data the extent of mis-pricing appears to be a reasonable predictor of the size of the reversal (I treated the recent reversal as part of the Dot.com reversal, i.e. as an outlier - I don't regard deliberately shooting yourself in the foot as a typical "market" phenomena).

However if the 88% reversal from 1929 to the eventual bottom three years later is taken out there is not a good predictor relationship (33% R-Squared is about random; although there is a range - only 5% chance of being outside the dotted line).

Anyway, market-long-wave analysis says that for DJIA breaking 10,000 in 2009 it will be 37% to 42% mis-priced (below); and that's for worst case nominal economic growth of minus 4% in 2009 and let's say worst case the 10 Year Note goes up to 4.5% from now (as the men in suits with their hands deep in the US taxpayers pockets try and raise more trillions - I won't discuss what they are holding in those hands).

And the downswing predicted from the previous upswing is 42%, so that looks about the bottom in mis-pricing on the downside to me.

Looking at the chart, it appears there has never been a major reversal of the DJIA (i.e. greater than 15%) when the mis-pricing was more than 10% (under), so regardless of the impeccable logic for why this was a sucker-dead-cat, I just don't see a reversal coming any time soon.

Looking at that another way, the extent of reversal compared to the history with the diameter of the rings sized to represent the extent of reversal:

This chart illustrates that reversals typically seem to happen when the market is mis-priced above the estimated "other-than-market", which intuitively makes a lot of sense.

Also, the size of the reversal appears to be broadly proportional to the speed at which the market went out of equilibrium and over 45 years when the market was mis-priced under.

Only three reversals happened when mis-pricing was negative and in each case the line was moving up towards zero, minimum was 10% mis-priced. That compares to twelve major reversals in the 45 years it was mis-priced over.

So right now, if indeed the Dow is about 40% mis-priced under, for it to be 10% mis-priced it will have to reach 14,000 this year which would be a bit of a stretch (history suggests it's going to bumble along in the range -30% to -45% for the next year at least).

So where does this leave the sucker-dead-cat-bounce rally, downgraded to a chump-rally?

My view from looking at that data, and assuming that the bankers are not going to manage to screw things up in 2009 as badly as they did in 2003 to 2007 (i.e. "no more surprises or super con tricks this rip-off-and-run season"), then it's highly unlikely that there will be a significant (more than 15%) reversal in the DJIA (and the S&P 500 correlates with that), certainly not worth breaking into a sweat over until the DJIA goes through 10,000.

If there is, well, I'll ring the neck of this darn cat that's been sitting on my lap since early March and barbeque it.


p/s photo: Zhou Wei Tong


Many Sectors Moving Above Its 200-Day M.A.


Here is more comforting information that the US bull run may not be over so soon. Many analysts consider a stock moving above its 200-DMA to be a buy signal. Furthermore, it is also said that a bull market can be defined as one where major market averages are trending up above their 200-DMA. Through most of this bear market, we haven't seen many stocks or ETFs anywhere close to their 200-DMA. Now, that seems to be changing.

Thanks to the advent of ETFs in the US, it is easier to track movements in sectors. The sector ETFs are composed of many stocks, and that lends more credibility to the moving averages. There are a number of sector ETFs as well as the NASDAQ 100 have moved above their 200-DMA recently.
  • Technology iShares
  • Network iShares
  • Semiconductor iShares
  • Consumer Discretionary iShares

In addition, the NASDAQ Composite is a hair away from crossing over its 200-DMA and the Telecom iShares. Materials and Industrials ETFs are also only a few points away their 200-DMA. Looking farther afield, the iShares FTSE/Xinhua China ETF crossed above and now seems to be consolidating at a level above its 200-DMA. Other major market averages such as the Russell 2000 are only a few points away from their 200-DMA. Will they be rejected or will they power through and confirm something stronger than a bear market rally is underway?

How To Interpret Market Commentary & Analysis


We all get to read market analysis and commentary on a daily basis. These are information which will help us assess the pulse of the markets. As in anything, the ability to distinguish useless information from critical information is vital in helping us improve on how to read market. Below is the latest market report from AFP, my thinking process in purple.

US stocks find strength

May 2, 2009 - 7:47AM

Wall Street stocks wobbled higher overnight as investors digested mixed economic data and braced for the results next week of "stress tests'' on the US banking system. (This opinion is a broadstroke, and is an opinion not an absolute truth. Commentators will try to interpret the market gyrations by attaching reasons to price movements. Not all price movements have logical valid reasons. Sometimes its really just a random walk on Wall Street. There are one hundred and one reasons why investors sell or buy, but we somehow always need to find a logical daily explanantion for why prices move in a certain manner. I would love it if a commentator actually come out and say "I don't know, its random I guess" because in many cases there are really nothing "market moving", prices go up because there are more buyers than sellers, thats all).

The Dow Jones Industrial Average rose 44.29 points (0.5%) to finish at 8212.41. The tech-heavy Nasdaq composite ticked up 1.90 points (0.1%) to 1719.20 and the broad-market Standard & Poor's 500 index rose 4.71 points (0.5%) to 877.52. (This has more relevance as it looks at sections of the markets that moved differently. This is more useful in ascertaining whether there are pockets of strong interest in certain sectors, size of stocks, etc. When the broader index charged up, its a broad based rally, which means everybody is thinking stocks in general are good and is not even discriminating between actual unique fundamentals particular to certain sectors or stocks. Broad based rally indicate "bull market sentiment", the need to buy stocks just to not be left out. If certain sector indices significantly outperforms broader indices, it show a rerating in specific sectors, and may not indicate a bull market trend but rather a rebalancing of exposure to more favourable sectors. It may means that there are particular developments within a specific sector that caused that.)

Economic reports provided conflicting recovery signals on the sick economy now in its 18th month of recession. The troubled manufacturing sector contracted in April for a 15th consecutive month, the Institute of Supply Management said, but the pace of decline was less severe than most analysts projected. (This is good information as it allows me to benchmark where we are in the recession. The average length of a recession is about 16 months and we have gone past that. It also tells me that its worth looking more closely on possible upturn in sentiment and a willingness to be long in equities. If we were in the tenth or eleventh month of a recession, I would probably not be too eager to look at stock investments in general and go for an extended holiday).

The Commerce Department reported factory orders fell by a seasonally adjusted 0.9% in March, in line with expectations after a surprise February increase that had snapped a six-month decline. "The data is still mixed and far from anything solid. While the common theme here is still a contraction, it keeps feeling like a slower contraction,'' said Jon Ogg at 24/7 Wall Street. (Economic data basically tries to confirm what we know. If the bad data is not as bad, it will not move markets immediately. Economic data and trends are like pouring water into a barrel. You need cumulative data to indicate collectively that a certain trend has appeared, e.g. recovering, or not as bad as anticipated, only then will markets be moved by the data. These bits and pieces of economic data needs to be entered into the C drive of our brain and ingested along with other recent economic data for us to form a picture of trend.)

Investors were on tenterhooks waiting for authorities to announce the results of stress tests on the biggest 19 banks that received public bailouts, now expected next Thursday. "The timing of the release of bank stress tests may be giving the market some jitters,'' said Al Goldman at Wachovia Securities. Bank of America dropped 2.6% to $US8.61, JPMorgan Chase shed 1.5% to $US32.49 and Wells Fargo lost 2% to $US19.61. (I have already posted on the likely impact of "stress test" for banks. On the surface it may be seen as negative for those banks being asked to raise capital - but the imposition of the test and its transparency should bolster confidence in the underlying strength of the banks, and may convince more that the worst for banks is coming to an end).

Citigroup, which is trying to raise capital to pay off $US45 billion ($A62.06 billion) in public aid, fell 2.6% to $US2.97 after announcing a deal to sell its Japanese brokerage Nikko Cordial to Japanese megabank Sumitomo Mitsui which was expected to generate $US2.5 billion ($A3.45 billion) in equity.

Among other stocks in focus, Alcoa added a hefty 6.8% to $US9.69. The aluminum producer said it was to sell to Platinum Equity most of its electricity equipment business, which employs about 17,500 people worldwide, for an undisclosed sum.

The market punished firms with earnings reports including credit card company Mastercard, down 5.7% at $US172.90, and insurer MetLife, off 7.7% at $US27.45.

Car stocks were under pressure after dismal April sales reports and Chrysler's appearance at a bankruptcy court hearing in New York a day after filing for Chapter 11 bankruptcy protection.

General Motors skidded 5.7% to $US1.81 and Ford fell 4.8% to $US5.69.

A strong surge in crude prices lifted oil majors. ExxonMobil leapt 2% to $US68.01 and Chevron rose 1.2% to $US66.87 after reporting a better-than-expected profit plunge in the first quarter.

"The earnings news continues to be somewhere between awful and really bad for most companies, but above expectations, which has given Wall Street a lift over the last month,'' Mr Dickson said. (The many corporate actions and earnings announcement should be kept in our C drive as well. Take note on market leaders, results from second and third liners are not as important. These are important in that earnings NEED NOT be rising for a market to turn. Earnings need only be NOT AS BAD as expected for market sentiment to turn).

April produced powerful gains, pushing the Dow up 7.3%, the Nasdaq a hefty 12.3% and the S&P by 9.4%, marking its best month-on-month rally in more than nine years.

The bond market dipped on Friday. The yield on the 10-year US Treasury bond rose to 3.174% from 3.124% on Thursday and that on the 30-year bond advanced to 4.088% from 4.044%. Yields and prices move in opposite directions.

AFP

p/s photo: Son Dam Bi