
 As things get more uncertain, it is useful to look at things that would help us understand the pulse of the market better. The first is the relative market valuations within various sectors or category of stocks. A look at the table below would allow us to form a good idea of the themes and plays in the markets now. Interestingly, the fundamentals indicate that investors have an appetite for risk. Tech stocks and small caps are being rewarded with the highest P/E ratios and these stocks deliver the lowest yields. Investors are pricing large cap stocks with higher yields more conservatively, possibly indicative of the uncertainty. Merrill Lynch analyst David Rosenberg recently revised his earnings forecast for S&P 500 stocks down to $28 in 2009. That puts the P/E for the S&P 500 at 29.5. He also projects operating earnings of $55 for 2010. Applying a classic recession-trough multiple of 12x against a forward EPS estimate of $55 would imply an ultimate low of 666 on the S&P 500, likely by October if our estimate of the timing for the end of the official downturn is accurate. That is easily another 20% down from present levels. If only things were that simple and straight forward. There is a theoretical valuation and projection, and there are things we cannot really project fully. In my view, the S&P 500 will not even dip below
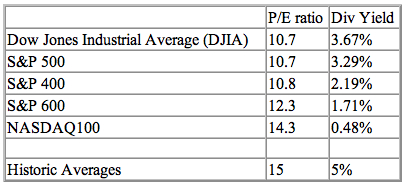
Table 1: data as of market close, Feb 13, 2009 source: Yahoo! Finance
700 because of sellers' exhaustion. It all has to do with relative yield and returns analysis. Michael Carr noted correctly that by applying Rosenberg’s estimate to a different valuation model offers a slightly more bullish scenario. The “Fed model” uses the interest rate on the ten-year Treasury note to develop a market forecast. The current yield of 2.88% implies that the market can support a P/E ratio of 34.7 for 2009 earnings. This gives a fair value of 971 on the S&P 500, or more than 17% higher than the current level. However, there is an average 16% risk premium priced into stocks according to this model, which places the current level of the S&P 500 at fair market value. I would still side with the bulls on the current market tussle.
Now onto short positions in the US markets. This to me gives me a better feel on the volatility and negativity than say the VIX indicator. You get to see what real players are betting against and how the flow of positions are moving.
COMPANY / JAN 30, 2009 / JAN 15, 2009 / NET CHANGE / PCT CHANGE -----------------------------------------------------------------------------
FIVE BIGGEST INCREASES IN SHORT POSITIONS:
- General Electric Co / 167,972,565 / 142,508,373 / 25,464,192 / 17.87%
- Citigroup Inc / 180,983,983 / 162,793,089 / 18,190,894 / 11.17%
- Banco Santander S.A./ 32,658,235 / 19,383,491 / 13,274,744 / 68.48%
- Pfizer Inc / 89,402,555 / 78,153,592 / 11,248,963 / 14.39%
- New York Community / 28,781,736 / 18,439,584 / 10,342,152 / 56.09%
General Electric continues to be betted against - nobody really thinks that GE will collapsed but that margins and their financial side will drag the company share price lower with each quarterly earnings - good to short. Citigroup despite having losses guaranteed, are still a firm favourite for shorties. The company is not out of the woods yet. Surprisingly Bank of America is not here, I think it could be that the share price of BoA has gone too low for shorts to be interested.
FIVE BIGGEST DECREASES IN SHORT POSITIONS:
- Nokia Corp / 18,552,903 / 38,313,687 / -19,760,784 / -51.58%
- Wells Fargo & Co / 111,677,537 / 125,872,995 / -14,195,458 / -11.28%
- Wal-Mart Stores / 40,345,362 / 50,760,650 / -10,415,288 / -20.52%
- Johnson & Johnson / 25,595,022 / 33,671,605 / -8,076,583 / -23.99%
- EMC Corp / 45,809,727 / 53,372,969 / -7,563,242 / -14.17%
Well this group is the one you want to be in. It shows the companies that have seen most short positions being covered, generally meaning the stocks are more than likely to go up from hereon. Surprise to see Wal-Mart there, I think it was due to some betting that the recent quarterly results will surprise on the downside - nah, they did well, thus scaring the shorts to cover. Johnson & Johnson is thought to be a solid stock, but to the shorts, even good companies are good candidates to short because too much buying or too much good news means the company is priced to react nagatively to any slight hint of bad news.
FIVE BIGGEST POSITIONS:
- Ford Motor Co / 273,286,779 / 270,453,510 / 2,833,269 / 1.05%
- Citigroup / 180,983,983 / 162,793,089 / 18,190,894 / 11.17%
- General Electric / 167,972,565 / 142,508,373 / 25,464,192 / 17.87%
- AIG / 128,659,009 / 131,310,541 / -2,651,532 / -2.02%
- Wells Fargo & Co / 111,677,537 / 125,872,995 / -14,195,458 / -11.28%
No company wants to be in this group. The longer they are in this category, the more downward pressure on the share price. Unless somehow these companies can engineer a dramatic short covering rally, e.g. beating analysts estimates or positive policy developments.
Generally speaking I don't see any major changes in sentiment from the positions taken by the shorts. They are reasonable plays, and they are plays which are basically betting on a down trending share price rather than looking for a total collapse or that the company's share price is going to zero.
p/s photos: Moe Oshikiri
No comments:
Post a Comment