The trouble is exacerbated when fundamentals cannot explain these 3 days of weakness, we go searching for reasons, and usually they are the wrong ones. Some will cite that Obama's health care plan faces a setback with a Republican taking over the late Ted Kennedy's seat... some will say its Obama's thinking of implementing a tax on "traders or firms taking prop positions" ...
The whole thing is further exacerbated by people looking to charts and technicals to explain the situation - this is the best part, when all other reasoning fails, let's look at charts ... well you might as well consult a fengshui master. Charts are not so bad really, they are tools which can help us.
I came across a pretty straight forward guy looking at technicals of emerging markets, pretty OK.
-------------------
Richard Shaw is the managing principal of QVM Group LLC, a fee-based investment advisor based in Connecticut. QVM manages portfolios uniquely designed for each client on a flat fee basis through the client’s own accounts at Schwab, Fidelity or Vanguard.
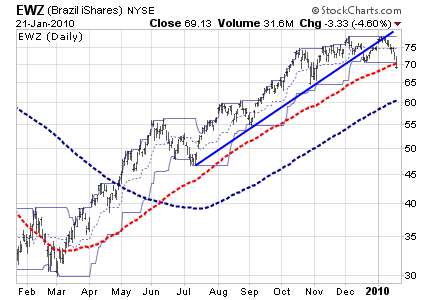
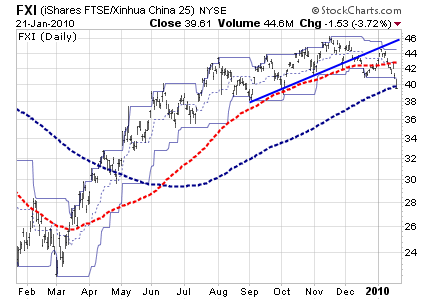
The BRIC countries are a mixed story. Brazil and China have clearly broken support, while Russia and India are still in rising patterns. Brazil may be a Sell. We think China is a Sell. Brazil has broken three conceptual support levels — its trend line connecting recent bottoms, its 21-day lower price channel and its 100-day moving average (in red). The 200-day average (in blue) is about 15% away.
As of January 21, China has broken four of four conceptual support levels, including its 200-day moving average, which is generally held to be a major significance.
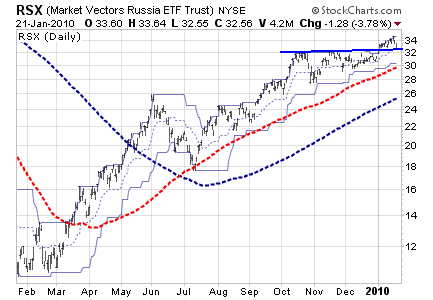
Russia is in a rising pattern, but is testing a support level created by two recent highs that had formerly provided resistance. That support level is above the price channel and moving average support levels.
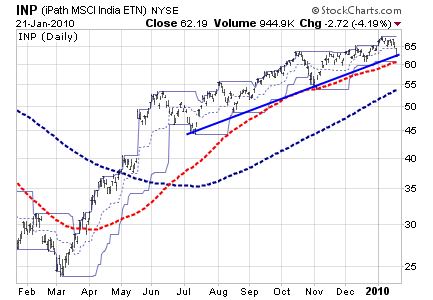
India is still in a rising pattern, but is close to a level where three conceptual supports converge (trend line, lower 21-day price channel and 100-day moving average).
The other countries within the emerging markets index are also a mixed bag.
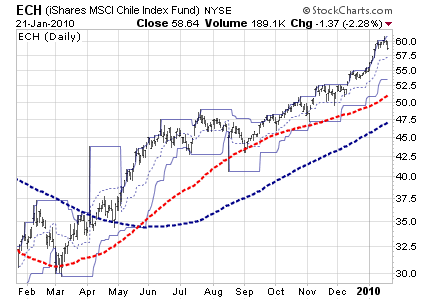
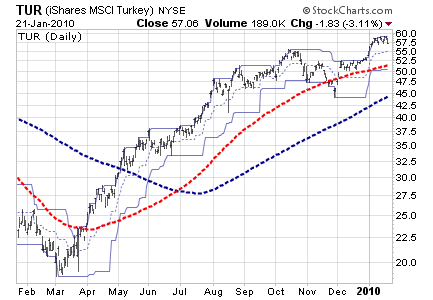
Chile and Turkey are the two with the strongest current price patterns.
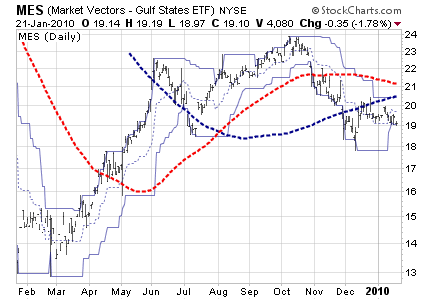
The Middle East has the weakest price pattern.
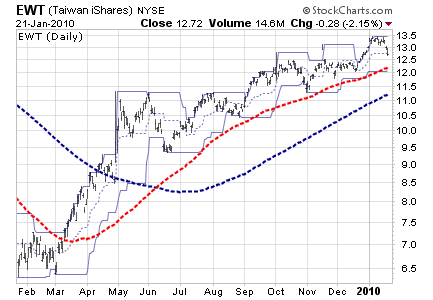
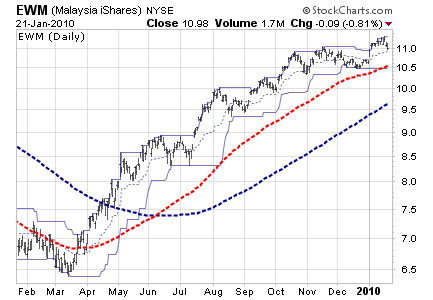
Taiwan and Malaysia are in OK price chart conditions.
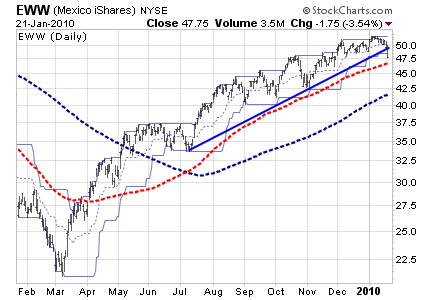
Mexico is still in a rising pattern, but has pierced its bottom connecting trend line and its 21-day lower price channel. The 100-day moving average is not far away.
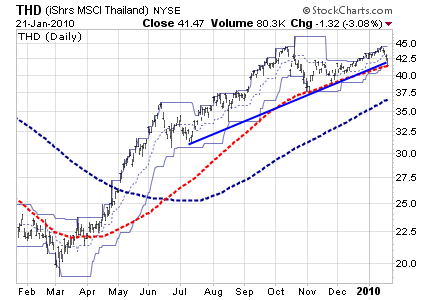
Thailand did not exceed its high achieved in October and is now at critical support formed by the convergence of its trend line connecting bottoms, its 21-day price channel and its 100-day moving average.
My concluding view is that we are just in an adjustment mode, I do think the markets will resume its bullishness very soon. I also see some markets drifting away from each other as the domestic liquidity conditions and monetary policies are diverting. Many are trying to rein in excessive lending and excessive property price speculation. I do think Malaysia is less affected by these issues. You should also read the recent posting on PEG ratios to get a better view that not all markets are similar, we are all going up using different routes.
No comments:
Post a Comment